
Everybody asks the same thing about a house in Ipswich. Does it flood.
Fair question. This is a city that went under in 2011 and again in 2022, and you do not have to ask around for long before somebody tells you about a kitchen they lost. What changed is that the honest answer got a lot more detailed on 1 July 2025, and almost nobody noticed.
That was the day the Ipswich City Plan 2025 replaced the 2006 planning scheme, and the flood map went with it. The old map drew one line around the city. The new one grades the ground into 5 bands, and the top band is called Extreme.
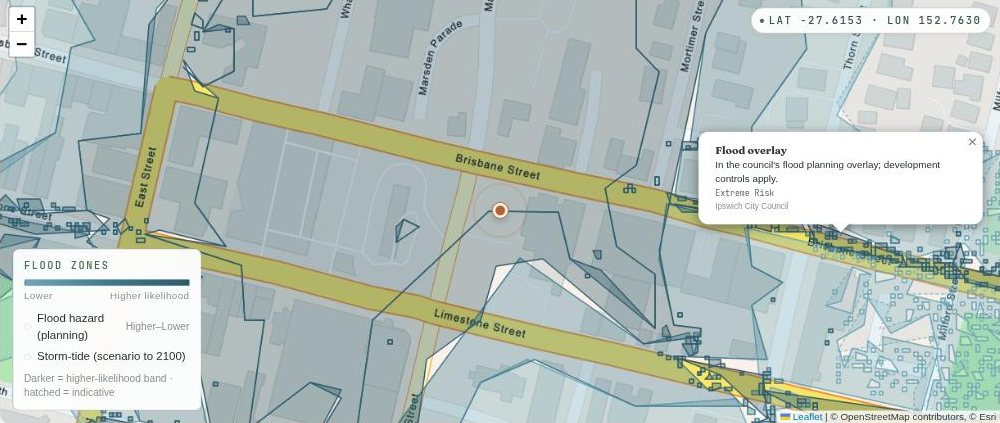
What the 5 bands are
As at 4 September 2026 we hold 426,822 separate mapped pieces of the Ipswich flood overlay. Here is how they split.
| Council band | Mapped pieces | Ground mapped | Addresses in the band |
|---|---|---|---|
| Extreme Risk | 22,455 | 101 sq km | 3,457 |
| High Risk | 121,417 | 38 sq km | 2,985 |
| Medium Risk | 125,939 | 40 sq km | 6,422 |
| Low Risk | 82,421 | 69 sq km | 10,570 |
| Very Low Risk | 74,590 | 95 sq km | 23,345 |
Coverage: a snapshot of the Ipswich City Plan 2025 flood overlay as at 4 September 2026, not a running total. Ground area is measured on the WGS84 ellipsoid and rounded to whole square kilometres.
The shape of that table is worth a second look. The Extreme band covers the most ground of the 5, about 101 square kilometres, and carries the fewest addresses. Work it out per square kilometre and Extreme holds about 34 addresses, Very Low about 245. The worst ground is mostly empty ground. Mostly. 3,457 addresses are sitting on it.
About a third of Ipswich has a flood band on it
343 square kilometres of the Ipswich council area sits inside one of the 5 bands. The whole council area is 1,094 square kilometres, so that is about 31% of the ground.
Addresses run a bit higher than ground does. 46,779 of the 130,532 addresses inside the council boundary sit in a band, which is about 36%, a bit more than 1 in 3. Of those, 6,442 are in the top 2 bands.
It is not only the river, and that is why the number is so big
The overlay is called Flood Risk and Overland Flow, and the second half is the half people forget. Overland flow is just rain running across the ground on its way to a creek. It can put a house a long way from any river inside a band.
Ipswich City Council says so on its own floods page: overland flow flooding "affects a large proportion of existing urban areas across the city". The same page says City Plan was adopted on 1 July 2025 and carries a flood risk overlay "to guide development in these areas".
That last phrase matters more than it looks. A band is a planning line. It decides what you are allowed to build on the land and what has to be assessed first, it is not a forecast that your house is going to get wet.
The copy everybody can download for free is the 2006 one
Here is the part that made this worth writing up.
Search the national open data catalogue for Ipswich flooding and you get exactly 1 dataset. Its title, word for word, is SUPERSEDED 2006 - Ipswich Planning Scheme Overlay - OV5 Flooding and Urban Catchment Flow Paths. Ipswich City Council published it. The files were last touched in March 2020 and every shape inside them is stamped 2 August 2019.
We pulled it down and counted. 288 shapes. 264 of them are urban catchment flow paths, which are the small drainage lines. 22 are drainage assessment areas. That leaves 2 shapes to carry the flood extent of an entire city, an adopted flood regulation line and a lesser development line sitting inside it.
One shape for the flood line of a whole city. No band on it, no grade. You are in it or you are not.
The overlay actually in force has 426,822 pieces, roughly 1,480 times as many, and every one of them carries a band. The old flood regulation line covered about 142 square kilometres of ground. The overlay in force maps 343.
We were serving the old one too, until this week. Worth saying out loud, because the whole point of this site is that a number has a receipt behind it, and for Ipswich ours was pointing at a scheme that had stopped being in force over a year ago.
The suburbs where the top 2 bands land
This is every Ipswich suburb with 500 or more addresses where at least 1 in 10 of them sits in Extreme or High. It is the complete list at that cut, not a top ten. 53 Ipswich suburbs clear the 500-address floor and 15 of them reach 10%.
| Suburb | All addresses | Extreme | High | In the top 2 bands | In any band |
|---|---|---|---|---|---|
| West Ipswich | 514 | 72 | 97 | 32.9% | 82.7% |
| Churchill | 1,032 | 177 | 73 | 24.2% | 69.7% |
| North Booval | 1,560 | 105 | 241 | 22.2% | 100.0% |
| Barellan Point | 809 | 87 | 90 | 21.9% | 88.6% |
| Basin Pocket | 506 | 44 | 50 | 18.6% | 100.0% |
| East Ipswich | 1,317 | 126 | 109 | 17.8% | 93.6% |
| One Mile | 1,009 | 57 | 117 | 17.2% | 98.7% |
| Ipswich | 2,903 | 322 | 145 | 16.1% | 77.0% |
| Gailes | 943 | 111 | 41 | 16.1% | 75.7% |
| Goodna | 4,790 | 184 | 534 | 15.0% | 53.9% |
| Purga | 544 | 51 | 28 | 14.5% | 39.9% |
| Karalee | 2,932 | 174 | 206 | 13.0% | 77.7% |
| Tivoli | 741 | 50 | 36 | 11.6% | 58.7% |
| Woodend | 777 | 35 | 51 | 11.1% | 81.6% |
| Bundamba | 3,849 | 271 | 150 | 10.9% | 56.8% |
Coverage: address counts are a snapshot as at 4 September 2026. Every Ipswich suburb with 500 or more addresses and 10% or more of them in the top 2 bands is here, in order, with nothing removed. The CSV carries all 84 Ipswich localities, including the small ones.
Goodna is the name everybody expects and it is in there at 15.0%, but 9 suburbs sit above it and most of them never come up in a flood conversation.
Two suburbs have every single address inside a band. North Booval, 1,560 of 1,560. Basin Pocket, 506 of 506. Read that carefully before you panic on somebody elses behalf, because most of those addresses are in the Very Low band. It means the whole suburb is mapped, not that the whole suburb is in trouble.
The newer estates sit at the other end. Springfield Lakes has 3.9% of its addresses in any band at all, Ripley 5.6%, Flinders View 5.8%, Redbank Plains 12.1%, against about 36% across the council area. Nobody plans a new estate in a floodway, and the mapping shows it.
Your street is not the answer either
This is the number that surprised me most. 2,569 Ipswich streets have at least 1 address in a flood band. 1,427 of them carry more than 1 band. 167 carry all 5.
Bergin Street in Booval is the one that made me sit up. 183 addresses on it and it carries all 5 bands, which is odd enough on its own. Then split them by house number. The even side holds 144 addresses and 94 of them are in Extreme. The odd side holds 39 and not 1 of them is in Extreme, High or Medium. Number 8 is Extreme. Number 9, across the road, is Very Low.
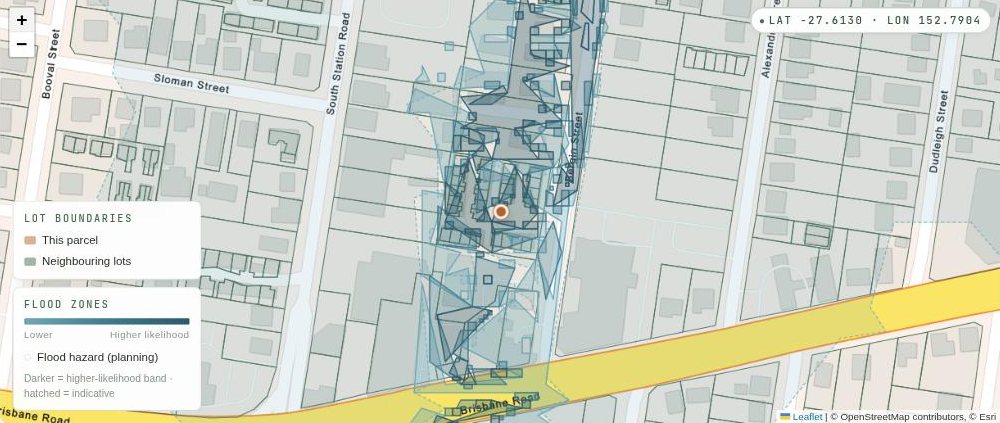
One side of one street.
It is not only the small streets either. Brisbane Street in Ipswich has 406 addresses and 400 of them are mapped. 65 sit in Extreme and 204 sit in Very Low, with the other 131 spread across the 3 bands in between. Put number 40 through our free check and it comes back High. Put number 130 through, same street, and it comes back Low.
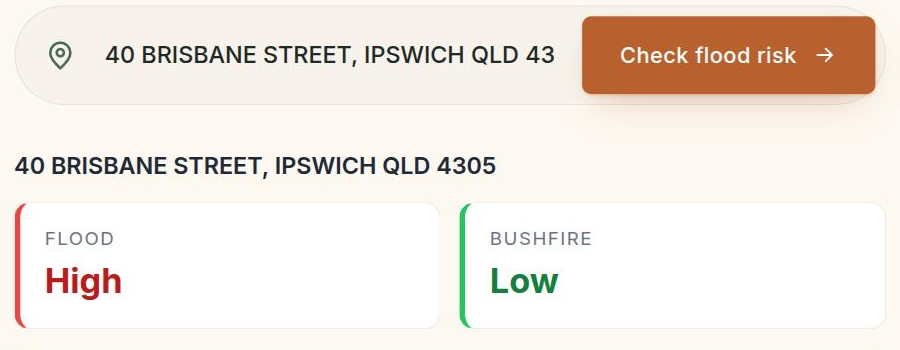
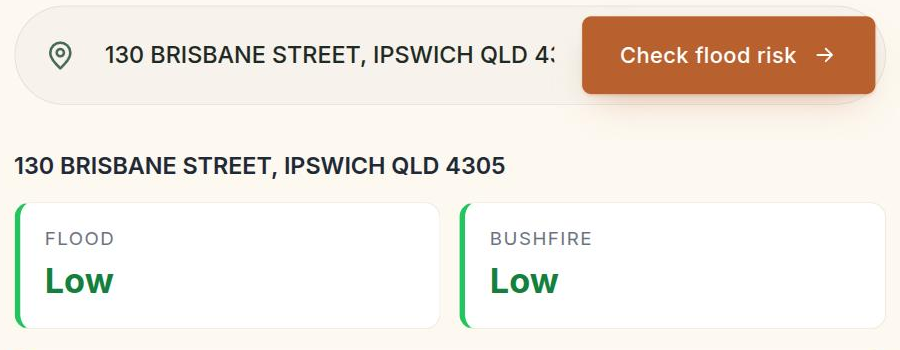
Same street. Different answer.
A note on that free check while the 2 pictures are in front of you. It hands back a coarse Low, Medium or High, so it reads the councils Extreme as High and its Very Low as Low. A Low there also covers an address that is not inside any mapped band at all, which is not the same thing as being in the mild one. The councils own 5-band word is on the address report.
458 Ipswich streets carry both an Extreme address and a Very Low one. So "is that street alright for flood" is a question with no honest answer. The lot is the unit. It always was, and now there is enough detail in the map to prove it.
A suburb average cannot answer this and neither can the street. Check the flood band on one Queensland address, free and no signup:
The streets with the most addresses in the Extreme band
Every street in the council area with 25 or more addresses in the Extreme band. That comes to 17 of them.
| Street | Suburb | All addresses | Extreme | High | Bands on this street |
|---|---|---|---|---|---|
| Brisbane Road | Gailes | 110 | 100 | 0 | 2 |
| Bergin Street | Booval | 183 | 94 | 3 | 5 |
| Warwick Road | Churchill | 176 | 79 | 4 | 5 |
| Turley Street | Ipswich | 66 | 66 | 0 | 1 |
| Brisbane Street | Ipswich | 406 | 65 | 9 | 5 |
| Mill Street | Goodna | 81 | 59 | 18 | 3 |
| Moores Pocket Road | Moores Pocket | 378 | 52 | 106 | 3 |
| Haig Street | Brassall | 166 | 51 | 9 | 5 |
| Mining Street | Bundamba | 62 | 50 | 4 | 5 |
| Pring Street | Ipswich | 66 | 44 | 6 | 4 |
| Riverside Avenue | Barellan Point | 110 | 40 | 36 | 5 |
| Lyndon Way | Karalee | 103 | 38 | 23 | 5 |
| Limestone Street | Ipswich | 195 | 36 | 40 | 5 |
| Keith Street | Bundamba | 30 | 30 | 0 | 1 |
| Lobb Street | Churchill | 97 | 29 | 13 | 5 |
| South Queensborough Parade | Karalee | 48 | 25 | 23 | 2 |
| Agnes Street | Bundamba | 27 | 25 | 2 | 2 |
Coverage: a snapshot as at 4 September 2026. Every street in the Ipswich council area with 25 or more addresses in the Extreme Risk band, in order. The CSV drops the cut to 10 and carries 67 streets.
Two of those are wall to wall. All 66 addresses on Turley Street in Ipswich sit in the Extreme band, and all 30 on Keith Street in Bundamba. The rest are mixed, which is the section above doing its work.
Every council words this differently
Worth knowing if you are comparing 2 places on opposite sides of a council boundary. "In a flood zone" does not mean the same thing on both sides.
| Council | What its flood overlay calls the land | Different flood classes we hold |
|---|---|---|
| Ipswich City Council | Five risk bands from Very Low Risk up to Extreme Risk | 5 |
| Toowoomba Regional Council | Four levels from Low up to Level FR4 - Extreme | 4 |
| Brisbane City Council | Very Low to High for each flood type, plus numbered flood planning areas | 28 |
| City of Moreton Bay | High risk and medium risk flood hazard areas, plus overland flow path | 10 |
| Redland City Council | Flood Regulation Line and storm tide inundation areas. No risk grade | 4 |
| Gold Coast City Council | Flood Assessment Required. One class. No risk grade | 1 |
| Logan City Council | Mostly one Flood Assessment Area, plus low, moderate and high risk areas | 6 |
| Sunshine Coast Council | Land Subject to Flood Hazard Overlay. One class. No risk grade | 1 |
Coverage: the flood overlay layers we held for each council on 4 September 2026. A council may publish more layers than we hold, so this describes our holdings rather than the full scheme.
2 of the 8 councils we map grade a band above High, Ipswich and Toowoomba. 3 of them do not grade at all, they mark the land and leave it there. So a Gold Coast lot marked Flood Assessment Required and an Ipswich lot marked Very Low Risk are not the same finding, and a plain yes on one map is not a plain yes on the other.
What to do when a band comes back
The band is information, not a verdict. What buyers actually do with it:
- Get an insurance quote before you sign, not after. The council map is not the insurers map and the band will not tell you the premium.
- Ask your broker early whether the band changes anything for the loan. Better to hear it in week 1 than in week 4.
- Point the building inspection at it. Ask them to look for signs of past water rather than hope it comes up.
- If the plan is to extend, knock down and rebuild, or split the block, take the band to a planner before you pay anyone for a design. The band is about building, so that is where it bites hardest.
- Ask the council for the property report on that address. It is their map, they will tell you what it says on that lot and what the overlay code asks for.
- If you end up buying in a band, get on the councils disaster dashboard before the first big wet, not during it.
One honest limit while we are here. We can tell you which band a lot sits in and we have not measured what that band does to a premium, to a loan, or to a resale price in Ipswich. Anybody who quotes you a number for those without showing you the working is guessing.
How we counted
We hold the councils overlay as it is published and cross it against the national address file, which is the same method as our Brisbane flood street counts.
An address here is a point in the national address file, so a block of 20 units counts 20 times, and a shed with its own address counts once. An address is in a band when its point sits inside that bands mapping. No address landed in 2 bands: the 5 band counts add to 46,779 and the count of addresses in any band is also 46,779, which is the check we run before publishing a table like this.
A street is a street name inside one suburb, so Brisbane Street in Ipswich and Brisbane Road in Booval are 2 different streets. Ground area is measured on the WGS84 ellipsoid. The council area figure is the ABS 2021 boundary for Ipswich, 1,094 square kilometres.
Everything here is a snapshot as at 4 September 2026. Councils amend overlays, and Ipswich already has an amendment package in train for City Plan 2025, so check the date on this page against the day you are reading it.
Questions people ask
Where is the official Ipswich flood map?
Ipswich City Council publishes it inside City Plan 2025 as overlay OV12, Flood Risk and Overland Flow. The council also keeps historical flood maps for the 1974, 2011 and 2022 events, which are a separate thing entirely. Both are reachable from the councils floods page.
What do the 5 Ipswich flood bands mean?
Very Low Risk, Low Risk, Medium Risk, High Risk and Extreme Risk. They are planning classes. What they change is what you are allowed to build on the land and what has to be assessed against the flood overlay code before you can build it.
Is Extreme worse than High?
Yes, Extreme is the top of the 5. Of the 8 Queensland councils whose flood overlay we hold, only Ipswich and Toowoomba grade a band above High, the other 6 stop there. As at 4 September 2026, 3,457 Ipswich addresses sit in the Extreme band and 2,985 in High.
Does a flood band mean the house has flooded before?
No, and this is the one people get wrong most often. The overlay is modelled mapping of what could happen, not a record of what did. The 1974, 2011 and 2022 flood lines are a different map. A house that stayed dry through all 3 of those can still sit in a band, and a house outside every band can still have had water through it.
Can I check a single Ipswich address?
Yes. Put it into our free flood check and you get a band for that address in a couple of seconds, no signup. The free check gives you a coarse Low, Medium or High, so an Extreme lot reads as High. The councils own word for the band, and the rest of what is registered on the block, is in the full report.
Flood band, easements, what has been approved next door, what the block has done before. Check any Queensland address, free and no signup: