
Sandgate is one of Brisbane's original bayside villages. About 17 km north of the CBD, sitting on Moreton Bay inside the Brisbane City Council area, with a foreshore, a heritage town centre and character housing that ranges from worker cottages to grand old Queenslanders. Unlike a lot of the northern suburbs it has its own railway station, on the Shorncliffe line, with Sandgate and Shorncliffe stations the last two stops on that branch (this is the Shorncliffe line, not the Doomben line, which is a separate northern branch that does not reach the bay). It is a suburb people have a feeling about. A buyer wants the numbers underneath the feeling.
We pulled three years of sales, the schools and catchments, the last 12 months of recorded offences, the flood and storm tide overlays and the census. Here is what they say. We stopped the price window at 2023 on purpose, because anything older drags in COVID-era distortion and turns a clean story into a noisy one.
Prices: a million-dollar house suburb since 2024
| Year | Houses sold | Median sold | P25 to P75 |
|---|---|---|---|
| 2023 | 53 | $970,000 | $850K to $1.20M |
| 2024 | 57 | $1,250,000 | $1.02M to $1.65M |
| 2025 (partial capture) | 22 | $1,025,000 | $955K to $1.34M |
| 2026 to June | 17 | $1,500,000 | $1.28M to $1.96M |
Read the line as 2023 to 2024 and then the trailing year, and the story is clear. $970,000 in 2023 to $1,250,000 in 2024 is a +29 percent jump on the median in a single calendar year, and Sandgate crossed the million-dollar house median in 2024. The 2025 row looks lower only because our capture for the first half of 2025 is thin (22 houses, against 53 and 57 in the two prior years), so it is a small sample, not a downturn. The most reliable current read is the trailing 12 months to June 2026, where 35 house sales median $1,300,000.
Sandgate is not a single market. The P25-to-P75 spread is wide (a quarter of 2024 sales settled under $1.02M and a quarter over $1.65M) because the suburb mixes renovated bayside character homes with original cottages on smaller in-town blocks. The median tells you the middle, but the band a buyer actually lands in depends heavily on position, land and whether the house is original or done.
Schools: a strong primary catchment, a split high catchment
Two schools sit physically inside Sandgate, and both are primary:
- Sandgate State School (government primary, ICSEA 1057, 387 students). Above the national average of 1000, around the 71st percentile nationally.
- Sacred Heart Primary School (Catholic primary, ICSEA 1063, 187 students). Also above average, around the 73rd percentile.
Sandgate has no high school inside the suburb boundary. The local government high school is Sandgate District State High School (ICSEA 1010, 993 students), which sits just over the boundary in neighbouring Deagon.
The primary catchment is the suburb's strong point. About 89 percent of Sandgate feeds Sandgate State School (ICSEA 1057), with small slivers on the edges falling into Shorncliffe State School (ICSEA 1122, a notably high result around the 90th percentile) and Nashville State School at Brighton (ICSEA 1058). All three primary options sit above the national average.
For state high school the suburb is split, and which side of the line you land on matters. Roughly two thirds of Sandgate falls into the Sandgate District State High School catchment (ICSEA 1010, co-educational). The remaining third, on the suburb's western edge, falls into Bracken Ridge State High School (ICSEA 981, just below the national average). Sandgate District sits a clear step higher on ICSEA, so a family buying for the high catchment should check the official Queensland Department of Education boundary at the specific address, not the suburb name.
Crime: a town-centre theft effect, and residential numbers edging up
We mapped every recorded Queensland Police Service offence to its ABS meshblock and counted only the meshblocks that sit inside Sandgate. Here is the 12-month picture to April 2026.
| Offence type | 12-month count |
|---|---|
| Other theft (excl. unlawful entry) | 165 |
| Good order offences | 74 |
| Other property damage | 33 |
| Unlawful entry (burglary) | 28 |
| Drug offences | 26 |
| Traffic and related offences | 26 |
| Assault | 25 |
| Handling stolen goods | 12 |
| Fraud | 10 |
| Unlawful use of motor vehicle | 10 |
| Trespassing and vagrancy | 10 |
| Weapons Act offences | 7 |
| Other offences against the person | 7 |
| Miscellaneous offences | 3 |
| Robbery | 2 |
| Liquor (excl. drunkenness) | 1 |
The two largest categories, other theft (165) and good order offences (74), are mostly a town-centre and foreshore signal, not a residential-street one. Sandgate has a busy retail strip and a popular bayside foreshore, and shop theft, public nuisance and similar good order offences are recorded to the meshblocks those places sit in. They inflate any headline total for the suburb and tell a residential buyer little about their own street.
The metric a residential buyer should actually look at is unlawful entry (residential burglary) and motor vehicle theft. Here is the year-on-year comparison.
| 12-month window | Unlawful entries | Motor vehicle thefts | Total recorded offences |
|---|---|---|---|
| Apr 2024 to Apr 2025 | 22 | 8 | 382 |
| Apr 2025 to Apr 2026 | 28 | 10 | 439 |
The honest read is that Sandgate's recorded crime edged up rather than held flat. Total recorded offences rose from 382 to 439, residential burglary went from 22 to 28 and motor vehicle theft from 8 to 10. These are small absolute numbers on a suburb of this size, and part of the rise sits in the town-centre categories rather than on residential streets, but the direction is upward, consistent with the broader Brisbane trend through 2025 and 2026.
Flood and storm tide: a genuine bayside consideration
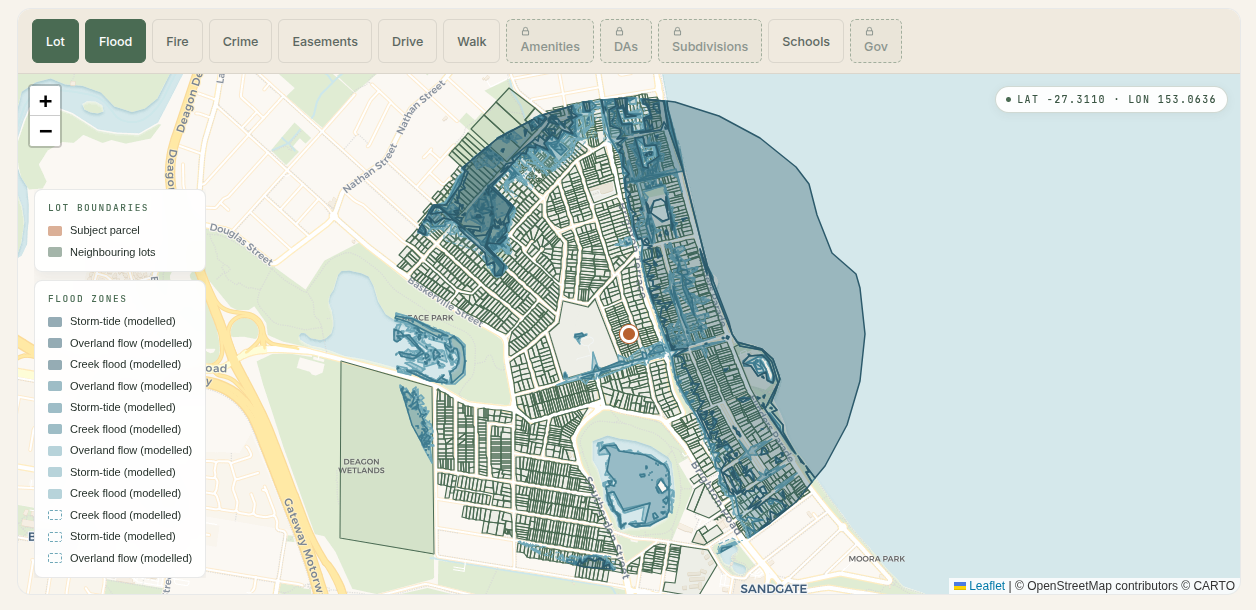
This is where Sandgate differs sharply from an inland suburb. Of 706 Sandgate properties we could place on the map, 344 (48.7 percent) intersect at least one Brisbane City Council flood or storm tide awareness layer. The driver is the bay, not a creek:
- Storm tide is the dominant layer. 315 properties (44.6 percent of the suburb) sit in a storm tide awareness area, and the exposure is not trivial: 301 of those carry a Medium or High storm tide rating and 242 are rated High. Storm tide is the risk of seawater pushed inland by a severe weather event on Moreton Bay.
- 36 properties sit in a creek flood awareness area, of which 19 carry a High or Medium creek rating.
- 32 properties have an overland flow classification, where water ponds on the block in heavy rain without needing a creek.
- 8 properties sit inside the recorded February 2022 historic flood footprint, a much smaller number than the river-and-creek suburbs further inland.
The takeaway is that Sandgate's flood question is mostly a storm tide question, and it is real for the low-lying, bay-facing parts of the suburb. About half the mapped properties are clean on every layer, and the exposed half is concentrated on the low and bay-facing ground rather than scattered at random. This is a suburb where the specific address and its ground level matter far more than the postcode, which is exactly why suburb-level flood claims mislead in both directions here. To cross-check a specific block, the state's FloodCheck flood maps map historical flood extents across Queensland.
Nearly half of Sandgate intersects a flood or storm tide layer. The only way to know which half your address is in is to check it, free:
Who lives here: the census profile
The 2021 ABS census figures below are for the Sandgate - Shorncliffe SA2, which covers Sandgate together with neighbouring Shorncliffe, so read them as a combined-area profile rather than Sandgate alone. They paint a settled, older, owner-occupier area:
- Population 6,826, median age 48 (clearly older than the Brisbane median, consistent with long-held bayside stock).
- Median weekly household income $1,908 and a median monthly mortgage of $2,167.
- Of 2,572 occupied private dwellings, 66.3 percent are owner-occupied (829 owned outright plus 875 with a mortgage) and 29.5 percent are rented.
- The dwelling mix is 1,933 houses, 569 units and 53 townhouses. Unlike the inland north Brisbane suburbs, the combined area carries a real unit component, much of it bayside apartments.
The older median age and high owner-occupier share are why stock turns over slowly and why long-held character homes only reach the market occasionally. It is a hold-and-live area more than a churn-and-rent one.
Rental yield: a low 3 percent on a house
QLD RTA bond data for postcode 4017 (which also covers Brighton, Deagon and Shorncliffe, so read it as a postcode figure, not Sandgate alone), most recent quarter to December 2025:
- 3-bedroom house: $670 per week median
- 4-bedroom house: $760 per week median
- 3-bedroom townhouse: $680 per week median
- 2-bedroom flat: $500 per week median
- 1-bedroom flat: $395 per week median
Against the trailing-year Sandgate house median of about $1.3M, a 3-bedroom house at $670 per week is a 2.68 percent gross yield, and a 4-bedroom house at $760 per week is about 3.04 percent. That is the usual inner-middle bayside Brisbane pattern: houses are a capital-growth hold on a thin yield, and the attached and unit product carries the better rental return per dollar. Sandgate is not a house yield play.
The honest answer
Is Sandgate a good suburb? It depends on what a buyer is solving for.
- For an owner-occupier who wants character housing, a bayside foreshore, a heritage town centre and a train station on the doorstep: it fits, with the caveat that the house median is now around $1.3M and a sub-$1M house is mostly original cottages on smaller blocks.
- For a family chasing schools: the primary side is strong, with about 89 percent of the suburb in the Sandgate State School catchment (ICSEA 1057). For high school, check which side of the line you are on, because Sandgate District State High (ICSEA 1010) is a clear step above the Bracken Ridge State High catchment (ICSEA 981) that covers the suburb's western edge.
- For a yield-focused investor: a house here yields in the high 2s to low 3s and is priced like bayside Brisbane. There is no house yield edge.
- For anyone buying on the low, bay-facing ground: take the storm tide question seriously and get the property-specific flood and storm tide history before bidding. Around 300 properties in the suburb carry a Medium or High storm tide rating.
Sandgate in 2026 is a pricier, owner-occupier-heavy, character-and-bayside suburb with a strong primary catchment, a split high catchment, recorded crime that is edging up off a modest base, and a real storm tide consideration for its low-lying streets. It is neither a hidden gem nor a trap. The data argues for honest, address-level due diligence rather than a yes-or-no on the suburb name.
Methodology
- Sales: median sold prices computed from recent residential sale records, matched to G-NAF address points inside the Sandgate suburb boundary (postcode 4017). $200K to $5M filter to remove obviously erroneous rows. Houses only for the year table; units and townhouses omitted as too thin to median. First-half-2025 capture for this suburb is incomplete, so the 2025 row is flagged as a partial sample and the trailing-12-month median is used as the current reference.
- Schools: ACARA MySchool ICSEA snapshot. Only schools physically inside the suburb are listed, with ICSEA taken from the school record.
- Catchments: Queensland Department of Education release. Catchment splits determined by spatial intersection of each catchment polygon with the Sandgate suburb boundary.
- Crime: Queensland Police Service recorded offence records, meshblock-coded, for the latest 12 months and the prior 12 months. Only meshblocks spatially inside Sandgate are included. Records begin mid-March 2024.
- Flood and storm tide: Brisbane City Council Flood Awareness Map (creek, overland flow, storm tide and February 2022 historic event layers), spatially intersected with G-NAF property points inside the suburb.
- Census: ABS 2021 Census, Sandgate - Shorncliffe SA2 (covers Sandgate plus Shorncliffe). Population, age, income, tenure and dwelling structure.
- Rentals: QLD Residential Tenancies Authority bond statistics, postcode 4017, December 2025 quarter.
Comparing the north side? Our deep dives on Boondall and Aspley cover the neighbouring suburbs on the same numbers, and you can test any Sandgate address against the flood overlays with our flood risk tool. For the wider Brisbane picture, see which streets carry the worst flood risk and the suburbs where recorded crime is falling, or browse all our Queensland suburb research.
Want the same check on a specific address in Sandgate, or any other address in Queensland? Try it below.