
Part one of this series found that Queensland councils almost never refuse a subdivision. Across six councils, 96.9% of decided applications were approved and 0.4% were refused. The real "no" was the withdrawal, where the applicant gives up part way through. That post left one question unanswered: how long does any of this take? We measured it, lodgement to decision, on every decided subdivision application in the six councils since January 2023. The median is 63 days. But the median is the least interesting number here, because the applications that fail sit in the system longer than the applications that succeed. None of this is advice, and the rules vary by council and zone, so always confirm your own block with a town planner.
Half are decided in about two months
| Time from lodgement to decision | Applications | Share |
|---|---|---|
| Under 1 month | 1,376 | 21.8% |
| 1 to 2 months | 1,665 | 26.4% |
| 2 to 4 months | 1,786 | 28.3% |
| 4 to 6 months | 686 | 10.9% |
| 6 to 12 months | 604 | 9.6% |
| Over 12 months | 201 | 3.2% |
Just under half are decided inside two months. That is the version of subdivision most people picture, and for about half of applicants it is roughly accurate. Then look at the bottom of the table. One in eight approved applications takes more than six months, and one in thirty takes more than a year. These are not rejections. They are the ones that got approved in the end and simply took a very long time to get there. The planning system does not fail loudly. It just takes longer than your spreadsheet assumed.
The applications that fail take longer than the ones that succeed
| Outcome | Applications | Median days | Slowest 10% take longer than |
|---|---|---|---|
| Approved | 6,318 | 63 | 207 days |
| Withdrawn | 178 | 76 | 376 days |
| Refused | 26 | 139 | 403 days |
A withdrawn application takes longer to die than an approved one takes to succeed. In Brisbane on its own, the median approved subdivision is decided in 67 days, while the median withdrawn one spends 111 days in the system before the owner walks away. The slowest 10% of Brisbane withdrawals grind on past 449 days. Failure is not a fast exit. You find out late, after you have paid the town planner, the surveyor, the application fee, and answered the information request from the council. That is what makes the withdrawal expensive. Not the fee. The months.
The withdrawals cluster after the money is spent
| When a withdrawn application was withdrawn | Applications | Share |
|---|---|---|
| Under 1 month | 38 | 21.3% |
| 1 to 3 months | 59 | 33.1% |
| 3 to 6 months | 36 | 20.2% |
| 6 to 12 months | 25 | 14.0% |
| Over 12 months | 20 | 11.2% |
About one in five withdrawals happens in the first month, the quick corrections and changes of mind. Everything below that line is the painful category. A quarter of withdrawals happen after six months or more, and one in nine after a year. By then the owner has been carrying the land, paying consultants and responding to council, and the answer still ends up being no.
Which council you lodge in changes the answer by more than double
| Council | Approved applications | Median days | Slowest 10% take longer than |
|---|---|---|---|
| Ipswich | 1,021 | 42 | 193 days |
| Redland | 610 | 50 | 167 days |
| Brisbane | 3,242 | 67 | 207 days |
| Toowoomba | 530 | 69 | 179 days |
| Moreton Bay | 654 | 70 | 250 days |
| Logan | 261 | 97 | 269 days |
Ipswich decides a subdivision in a median of 42 days. Logan takes 97. That is more than double, for the same kind of application on the same kind of block. If you are choosing between two candidate blocks in different council areas, this belongs in the comparison alongside the price. It rarely is.
More lots barely changes your odds. It changes who walks away
Part one found that most Queensland subdivision is one block into two. The obvious assumption is that the more lots you go for, the more likely you are to get knocked back. The data says that is wrong, and the real pattern is more useful. We pulled the intended lot count out of each application, so we could compare a 1 into 2 against a bigger split on the same terms.
| Intended split | Applications | Approved | Withdrawn or refused | Median days to approve |
|---|---|---|---|---|
| 1 into 2 | 1,028 | 95.3% | 4.7% | 69 |
| 1 into 3 | 308 | 92.2% | 7.8% | 85 |
| Into 4 to 5 | 269 | 94.8% | 5.2% | 80 |
| Into 6 to 10 | 103 | 91.3% | 8.7% | 100 |
| Into 11 or more | 404 | 96.5% | 3.5% | 88 |
Look at the approval column first. It barely moves. Whether you split one block into two or one into eleven, roughly 91% to 97% get approved. The number of lots is not what decides whether you get a yes.
Now look at who fails. The safest split is the humble 1 into 2, under 5% withdrawn or refused. The next safest is the big professional development at 11 or more lots, at 3.5%. The danger zone is the middle. A 1 into 3 fails at 7.8%, and a 6 to 10 lot split at 8.7%, close to double the 1 into 2 rate.
That shape makes sense once you see it. A 1 into 2 is simple enough that little goes wrong. An eleven lot development is run by someone with capital, a consultant team and no intention of walking away from a project that size. The person most likely to get halfway in and give up is the owner attempting three to ten lots: ambitious enough to trigger real engineering, drainage and infrastructure conditions, but not always resourced to push through them.
What a real split actually looks like
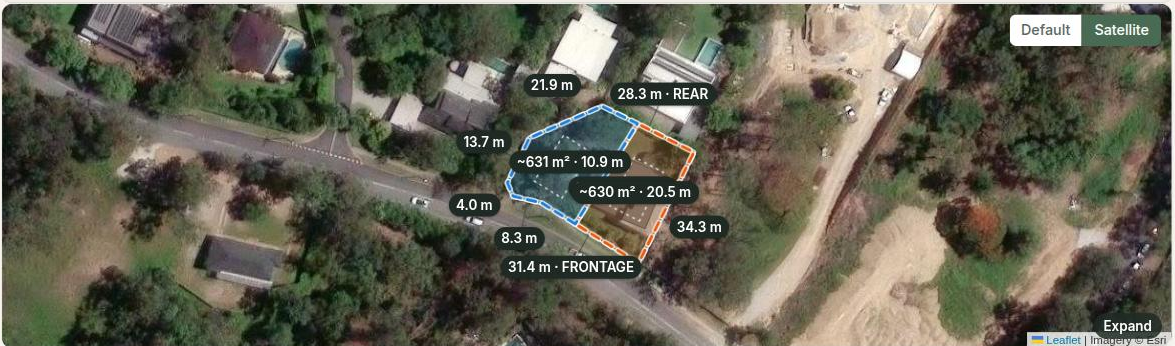
Numbers are one thing. Here is what the two common splits look like drawn on the block, straight from the Queensland cadastre.
A wide block splits side by side. This one at Fig Tree Pocket is about 1,260 square metres with 31 metres of frontage, so it screens as a straightforward two lot split, roughly 630 square metres each, both fronting the street.
A narrow deep block has to go front and rear instead: the classic battle-axe, where the back lot reaches the street down a thin access handle. This one at Darra keeps a roughly 400 square metre front lot and puts a 636 square metre lot behind it, down a 3.5 metre handle. It looks like free upside, but the rear lot has to clear the council minimum on its own before any of it counts, and that is exactly where a lot of these quietly fall over.
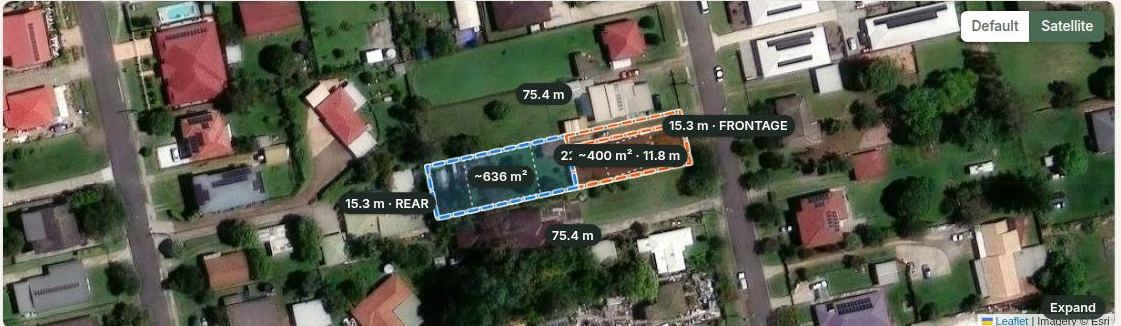
The shape of your block decides which of these is even on the table, and whether the sums work. You can see the same screen for any Queensland address.
Check any Queensland address for subdivision potential, free. Lot size against the council minimum, frontage, the battle-axe rear-lot test, and the overlays that quietly block a split:
Not sure where to start? Browse all our Queensland suburb research to see where blocks are being split, then run the individual address you are weighing up.
What this means if you are carrying the land
We do not publish cost figures for subdivision, for the same reason we did not in part one: reliable cost data is not in the source, and a made up number is worse than no number. Time is different. Time we can measure, and time is the input you can price yourself.
If you are funding a subdivision and capitalising the interest, the duration is not an administrative detail. It is the cost. Work out what one month of holding the land costs you, then look back at those tables and do the arithmetic on your own numbers: the good case is roughly two months in Brisbane, one in eight approvals runs past six months, and if it fails, budget for longer than the good case, not shorter.
That last point is the one to sit with. Most feasibility spreadsheets model a timeline for success and treat failure as simply not proceeding. The data says failure has its own timeline, and it is the longer one.
How to check your own street
Every council publishes its development applications, with the lodgement date and the decision date on each one. So you can measure your own street before you commit to anything. Open your council DA search (Brisbane uses PD Online), search your target street, find the reconfiguring a lot applications, and read the dates: lodged, decided, and the outcome.
If three people on your street have split a block and been approved, you know the split works there and roughly how long each took. If several lodged and withdrew, that is worth far more than any general article, including this one. Somebody already paid to learn what you are about to pay to learn. Precedent on your own street beats a state wide median every time.
The honest answer
- If you are splitting your own block: budget for two to three months in the good case, and understand the slow tail is real. One in eight approvals takes more than six months, and the system will not tell you early which one you are.
- If you are buying a block advertised as having subdivision potential: the timeframe is part of the price. A block that needs a nine month assessment is not the same asset as one that needs two, even if the plans look identical.
- If you are weighing whether to proceed at all: the failure case is slower than the success case. Ask what your holding cost looks like on the long timeline, not the short one, because the long one is where projects die.
Methodology
- The cohort: every subdivision application decided in Brisbane, Ipswich, Logan, Moreton Bay, Redland and Toowoomba, lodged from 1 January 2023 onward, from public council development records. Part one counted 6,768 decided applications in total. This post uses the 6,522 of them that have a measurable lodgement-to-decision time, and drops the rest, which have no usable decision date to measure. Same six-council cohort, and the same 96.9% approved, 2.7% withdrawn and 0.4% refused split.
- Duration: calendar days from lodgement to decision as published by the council. Not business days, and not the statutory clock, which pauses for information requests. This is elapsed time as the owner experiences it, which is the number that costs money.
- Lot counts: the intended lot count read from each application description. About a third of applications state a number this way; boundary realignments are excluded. Smaller buckets rest on a few hundred applications, so read them as direction, not decimals.
- No cost figures are claimed, because reliable cost data is not available in the source.
Companion read: what actually happens when you subdivide a block in Queensland, and all our Queensland suburb research.
Want to know whether your own block can be split, and roughly how long it might take? Look it up in Property X-Ray below.