
Three complete weeks of Brisbane listings. 380 homes cut their asking price where anyone could see it. Another 388 made their asking price disappear.
Almost exactly one for one, and the invisible one is the bigger of the two. That second number is the one nobody publishes, and its the reason I sat down to write this.
Before I go any further. I own property in Brisbane and I built a house here, so when the numbers go the wrong way they go the wrong way on me too. This isnt a piece laughing at sellers. Its a piece about what people actually do when the market stops answering them, and most of it is completely rational behaviour.
What I do is take a record of every home advertised for sale across greater Brisbane, every day, and keep it. Not just todays asking price. The whole run of them. That turns out to be the whole game, because the asking price is the only part the portals keep. Everything else gets written over the moment it changes.
Quick version, and there are two dates in this post doing two different jobs. Anything I count over a period runs on complete Monday to Sunday weeks and the last one closed on Sunday 2 August. Anything I call live is the market as it stood this morning, 4 August 2026. So: in the week of 27 July to 2 August, 142 Brisbane houses and townhouses cut their advertised price, median trim 4.4 percent. Across the three weeks to 2 August, 380 did. Another 388 swapped their dollar figure for words like "Contact Agent". And of the ones that cut a fortnight or so back, more than nine in ten are still advertised today.
A vendor whose price isnt working has four moves. They tend to come in that order, and each one is harder to see from the outside than the last. That gradient is the actual story here.
First they cut in public
This is the move everybody knows about. The ad said $899,000 last Tuesday and today it says $865,000, and the portal even puts a little tag on it so you dont miss it.
Here is where those cuts landed over the three complete weeks to 2 August, set against what each suburb had advertised this morning.
| Suburb | Listings | Price cuts | Silent cuts | Left, no sale |
|---|---|---|---|---|
| Redland Bay 4165 | 136 | 14 | 10 | 16 |
| Victoria Point 4165 | 97 | 12 | 10 | 6 |
| Russell Island 4184 | 147 | 10 | 6 | 15 |
| Wellington Point 4160 | 49 | 10 | 4 | 7 |
| Capalaba 4157 | 78 | 9 | 5 | 12 |
| Marsden 4132 | 68 | 8 | 7 | 7 |
| Woodridge 4114 | 67 | 8 | 7 | 7 |
| Slacks Creek 4127 | 43 | 8 | 1 | 5 |
| Greenbank 4124 | 110 | 7 | 16 | 6 |
| Birkdale 4159 | 68 | 7 | 9 | 5 |
| Thornlands 4164 | 64 | 7 | 1 | 8 |
| Albany Creek 4035 | 64 | 7 | 6 | 5 |
| Logan Reserve 4133 | 92 | 6 | 6 | 4 |
| Park Ridge 4125 | 71 | 6 | 7 | 7 |
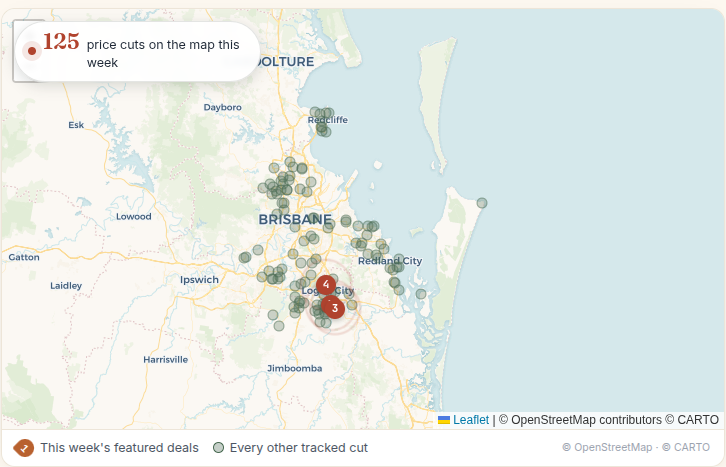
Read the postcodes and youll see it straight away. The bayside and the Logan corridor are carrying nearly all of it. Redland Bay, Victoria Point, Wellington Point, Capalaba, Thornlands, Birkdale and the islands, then Marsden, Woodridge, Slacks Creek, Greenbank, Logan Reserve, Park Ridge. Albany Creek is the only northern suburb on the board and the inner ring is not on it at all.
Wellington Point is the one that stopped me. 49 houses and townhouses advertised this morning, and 12 of them moved their price inside those three weeks. A quarter of the suburb.
When I posted a chunk of this data publicly, someone in Redland Bay described what it looks like from the footpath: listings multiplying on street after street. The record agrees with them. Redland Bay had 136 houses and townhouses advertised this morning and 23 of them had moved their price in the three weeks before that. Our Redland Bay deep dive has the longer view on that one.
One thing to separate out before we go on, because these two get mixed up constantly. The number usually quoted for Brisbane is a vendor discount, and it means the gap between the first advertised price and the final sale price on homes that have already sold. Its a small number and it should be, because it only counts the winners. Mine is a different measure: the trim on the ad, counted on homes that are still sitting there. A home that never sells never enters a discount figure at all, and unsold homes are the entire population of this post.
One more reconciliation while I am at it, because someone will go and check. I posted a version of this weekly figure publicly on Sunday and it read 133. That count ran across a different seven days and it was taken before the week had finished. Which matters more than it sounds. On identical rules, the three completed weeks in this post run 136 cuts, then 130, then 142. Shift the seven days by two and the number moves by ten. So from here I count completed Monday to Sunday weeks only, and I will always tell you which week you are looking at.
One more useful thing about the cut itself. It doesnt come early. Across those three weeks the median home that cut had been advertised at least 29 days before it moved, and a quarter of them held out past 47 days. Vendors give the original number a good month before they blink.
The trouble with cutting
Cutting is the obvious move. On this data its also the one that does the least.
252 Brisbane houses and townhouses that were already advertised on Monday 13 July went on to cut their price cleanly in the fortnight that followed. When I pulled the record this morning, 236 of them were still advertised. Thats 93.7 percent, one to three weeks after the cut.
Now, "94 percent still sitting" means nothing on its own if the whole market is stuck. So I ran the control. Same suburbs, same fortnight, same property types: 4,860 Brisbane listings that were live on 13 July and did NOT cut. 84.5 percent of those were still advertised this morning.
So the homes that cut were more likely to still be there than the homes that didnt. On the sale side its wider: 6.3 percent of the non-cutters had gone with a sale on the record, against 1.6 percent of the cutters.
Be careful with that, because its not the finding it looks like at first glance. These arent the same homes. A listing cuts precisely because it wasnt selling, so the cutting group is loaded with the hardest stock in the suburb before anyone touches the price. Nobody should read this as "cutting your price makes your home harder to sell".
What it does say is that the cut on its own, at the size vendors are actually doing it, does not rescue a campaign inside a month. The median trim across those three weeks was 4.3 percent, and in dollars the median came to $50,000. On this evidence fifty grand is rarely enough to move a home that four weeks of buyers have already walked past.
Give it longer and it softens, but not much. Of the 191 homes that cut in the fortnight from 29 June to 12 July, three to five weeks on, 76 percent were still advertised.
And some vendors are on their second go already. Across the three weeks to 2 August, 29 Brisbane homes cut their asking price twice.
Then they delete the price
This is the one I did not expect, and its now my favourite number in the whole record.
A listing can move from "Offers Over $920,000" to "Contact Agent". Nothing on the portal marks it. No tag, no strikethrough, no notification. If you didnt see yesterdays ad you have no idea anything happened. We call it a Silent Cut, and in the three weeks to 2 August, 388 Brisbane houses and townhouses did it. Over the exact same three weeks, 380 cut in public.
One for one, and the invisible move is fractionally the bigger of the two. For every Brisbane vendor who dropped their price where you could see it, another one made the price vanish.
45 homes did both, which tells you the sequence: cut once, it doesnt work, take the number down altogether.
And the ambient level is higher than most buyers realise. Of the 5,546 Brisbane houses and townhouses genuinely on the market this morning (I have taken out the ones already under contract), only 2,398 show you a dollar figure at all. 340 are auction campaigns, where no price is the whole method. The other 2,808 are just words. "For Sale". "Contact Agent". "By Negotiation". "Inviting Offers".
Thats 50.6 percent. More than half the Brisbane market will not tell you what it wants.
Which does something annoying to the one number everybody wants. Take the 1,734 greater Brisbane houses advertised this morning WITH a dollar figure on them, and the median number at the bottom of those ads is $1,169,500, with the middle half running from about $921,000 up to $1.5 million. Townhouses that show a figure sit at $875,000 off 336 ads. But thats the asking price, on the half of the market willing to name one, and a home that hides its price is not a random home. Treat it as where sellers are starting the conversation, not where buyers are finishing it.
Someone asked me what "inviting offers" actually means, and someone else answered them before I could, with one word: desperate. Thats too harsh. Its usually one of two things. Either the vendor genuinely doesnt know what the home is worth and would rather the market tell them, which is fair enough. Or the ask has come down and nobody wants a public record of it coming down.
Hiding the price IS the price cut.
Either way, treat a missing price as information rather than an absence of it. Then go and find out what else the ad isnt telling you.
Flood, easements, whats been approved next door, what the block has done before. None of that is in the ad either. Check any Queensland address, free and no signup:
Then they reset the clock
Here is the one that genuinely bothers me.
Pull a listing down. Put it back up a week later. The days-on-market counter starts again at zero. New campaign, fresh number, and the previous eleven weeks never happened as far as any buyer can tell.
My counter doesnt reset, because I keep the old ad. So I can see both numbers at once. This morning there are 81 Brisbane houses and townhouses advertised with a reset clock. Across those 81 homes only, not the market at large, the current ad has a median age of 10 days while the median time actually spent for sale is 61 days.
35 of the 81 look a week old or newer. 43 of them have been for sale at least two months.
Each row below is a different home. Eighty of the 81 are on their second campaign, not their fifth, so this isnt a few serial relisters dragging the medians around. I have kept it to suburb level on purpose, because the point isnt any one seller.
| Suburb | Current ad, days | Really for sale, days |
|---|---|---|
| Kuraby 4112 | 14 | 102+ |
| Loganlea 4131 | 12 | 98+ |
| Springwood 4127 | 28 | 96+ |
| Russell Island 4184 | 28 | 96+ |
| Logan Reserve 4133 | 3 | 94+ |
| Victoria Point 4165 | 7 | 94+ |
| Kingston 4114 | 20 | 94+ |
| McDowall 4053 | 3 | 89+ |
| Greenbank 4124 | 7 | 89+ |
| Woodridge 4114 | 20 | 89+ |
| Rochedale 4123 | 26 | 89+ |
| Wishart 4122 | 26 | 89+ |
We call that last column True DOM. The Kuraby home has been for sale since at least late April. Its current ad is a fortnight old. Same story down the rest of that list. Loganlea, Springwood, Kingston and Wishart each have a home whose real campaign is pushing three months while the ad in front of you reads weeks.
Someone asked me a very good question about this: does the portal enforce any kind of cooldown between one campaign ending and the next starting? Not one that shows up in the data. Up to 2 August I have logged 113 cases where a Brisbane home was delisted and then relisted. The median gap is 7 days. 60 of them were back inside a week and 93 were back inside a fortnight.
A week off, and the home is new again.
Then they leave
The last move is simply to go.
739 Brisbane houses and townhouses came off the market in the three weeks to 2 August. 319 of those have a sale on the record. The other 420 dont, at least not yet, and thats the number to handle carefully: sold data lags the actual sale by one to three months, so some of those 420 will turn out to have sold and simply not surfaced. The rest withdrew. We track that group as the Withdrawn Watch and we hold onto them, because a decent share come back. The running record of Brisbane homes that went off market is free to read.
Some suburbs quit rather than cut, and its usually the prouder ones. Carindale had 42 houses and townhouses advertised this morning, and across the three weeks before that, exactly one visible cut, one silent cut, and four homes that left with no sale on the record. Calamvale and Sunnybank Hills read the same way: 13 and 12 quiet exits against four price cuts each.
Those vendors arent capitulating. They are going back to the shed to think about it, and a lot of them will be back in spring with a new ad and a clock that says one day.
Which move is your suburb making
Same three weeks to 2 August, same rules, and the listing counts are this mornings. Suburbs really do have personalities.
- Cuts in public. Wellington Point, 49 listings and 10 visible cuts. Redland Bay, 14. Victoria Point, 12. If youre buying here the discount is on the board where you can see it.
- Hides instead. Rochedale did not put through a single visible cut and quietly took the price off 7 ads. Coorparoo, 1 and 6. Camp Hill, 1 and 5.
- Does both, hard. Greenbank, 7 visible and 16 silent off 110 listings, which is what a genuine oversupply corner looks like.
- Quits. Sunnybank Hills, Calamvale and Carindale. Low cuts, high exits.
- Barely moves at all. Bardon had 44 homes advertised, one price cut, no silent cuts, two quiet exits. Sellers there arent blinking yet.
I deliberately havent put New Farm or Ascot on that list even though people ask about them, because there are single-digit numbers of houses advertised in each and you cannot read a suburbs mood off nine listings. If your suburb is missing thats usually why, not neglect.
Questions to ask the real estate agent at an open home
Days on market is a negotiating-power meter, and its the single most useful number you can get before you make an offer. A vendor at day four does not need you. A vendor at day ninety whose first campaign already failed is a different conversation and often a different price.
So dont ask the agent how long its been listed. That question has a true and useless answer, because the current ad might be four days old. Ask this instead.
When did this property FIRST come on the market?
Then watch what happens. A straight answer is a good sign about the agent and the vendor both. A pause is information too.
Two more that work in this market. If theres no price on the ad, ask what the last advertised price was and when it changed. And if the answer is "the vendor is inviting offers", ask what offers they have already turned down. Nobody has to answer either one. How they handle being asked tells you plenty.
The wider point is that you are no longer stuck arguing about how urgent a sale is. There are two second viewings booked tonight, maybe there are. But a campaign history is checkable and a feeling isnt, and once you know a home has been for sale since April you can stop negotiating against a story.
Then go and check the boring stuff yourself before you fall in love with it.
How I counted this
Worth being straight about the limits, because most of the numbers above are minimums.
- "Brisbane" here means postcodes 4000 to 4199. Thats the council area plus Logan, the Redlands and the southern end of the Redcliffe peninsula, so its wider than Brisbane City Council.
- Two clocks, kept apart on purpose. Anything counted over a period runs on complete Monday to Sunday weeks and the last one closed on Sunday 2 August 2026. Anything described as live, advertised now, or this morning is the market as at 4 August 2026. A count and a snapshot never share a date in this post.
- A change is counted on the day I see it, not the day the vendor made it. So a weeks count is an observation week and it can trail the real thing by a day or two. It also means a week is only worth quoting once the week has closed.
- Houses and townhouses only. Units, apartments, land and acreage are out, and so is project stock: house-and-land packages, staged releases, anything advertised as "From $X". A builder swapping which package is on display looks exactly like a panic price cut in raw data, and it isnt one.
- A price cut is counted once per listing per window, not once per event. Listings with three or more drops in a window are thrown out, because thats usually a hidden-price ad flickering rather than a person making a decision. Anything reading as a cut deeper than 22 percent is also thrown out, because at that size its nearly always a bad price parse.
- Every days-on-market figure counts from the day I first saw the home advertised, not the day it truly first listed. They are all floors. The real campaigns run longer than what I have shown.
- Withdrawn means "came off the market with no sale on the record yet". Sold data lags one to three months, so treat that group as provisional. Some of them sold.
- The record starts in late April 2026 and daily watching starts in June, so a chain of campaigns is only visible where I saw the earlier one die. There are older reset clocks out there that I cannot see yet.
Companion reads: every development application in Brisbane, ranked by suburb for what is getting built next door, and Brisbane suburbs where crime is falling for the other half of the homework. If you would rather see the price moves as they happen than wait for a writeup, the weekly Brisbane cut list lives on the Deal Radar page and its free.
FAQ
Are house prices dropping in Brisbane?
Advertised prices are moving down in specific corridors rather than across the city. In the complete week of 27 July to 2 August 2026, 142 greater Brisbane houses and townhouses cut their advertised price with a median cut of 4.4 percent, and those cuts concentrated heavily in the bayside and Logan corridors while inner-ring suburbs barely moved. For scale, the median asking figure across the 1,734 greater Brisbane houses advertised with a price as at 4 August 2026 was $1,169,500. Note that all of this is advertised price, not settled sale price. They are different measures and they move at different speeds.
How many Brisbane homes are hiding their asking price?
Slightly more than half. Of 5,546 greater Brisbane houses and townhouses advertised as at 4 August 2026 and not yet under contract, 2,398 showed a dollar figure, 340 were auction campaigns and 2,808 showed only wording such as "Contact Agent" or "Offers Invited". Over the three complete weeks from 13 July to 2 August 2026, 388 listings moved from a dollar figure to wording, which is marginally more than the 380 that cut their price in public over the same three weeks.
Does relisting a property reset days on market?
Yes. When a listing is withdrawn and a new one goes up, the counter starts again from zero. As at 4 August 2026 there were 81 greater Brisbane houses and townhouses advertised with a reset clock. Across those homes the current ad had a median age of 10 days while the median true time on market was 61 days. Across 113 delist-and-relist pairs logged up to 2 August 2026, the median gap between campaigns was 7 days, so there is no meaningful cooldown showing in the data.
Does cutting the asking price actually sell a Brisbane house?
Not on its own, at the size vendors are currently cutting. Of 252 greater Brisbane houses and townhouses that were advertised on 13 July 2026 and then cut their price in the fortnight to 26 July, 93.7 percent were still advertised as at 4 August. Of the 4,860 that were live on the same Monday and did not cut, 84.5 percent were still advertised. The cutting group selects itself (a home cuts because it wasnt selling), so this is not evidence that cutting hurts. It is evidence that a single trim of around 4 percent rarely ends a campaign inside a month.
What questions should you ask a real estate agent when buying?
The one that matters most is when the property FIRST came on the market, not how long it has been listed. Those are different questions and a relisted home makes them very different: as at 4 August 2026 there were 81 greater Brisbane houses and townhouses whose current ad had a median age of 10 days while the median true time on market ran to 61 days. Two more worth asking. If theres no price on the ad, what was the last advertised price and when did it change, because 2,808 of the 5,546 greater Brisbane houses and townhouses advertised that morning showed wording instead of a dollar figure. And if the vendor is inviting offers, ask what offers have already been turned down. Nobody has to answer any of it. How the agent handles being asked is information too.