
Redland Bay sits on the southern edge of Moreton Bay, around 35 km south-east of the Brisbane CBD, inside the Redland City Council area. It is the mainland gateway to the Southern Moreton Bay Islands: passenger and vehicle ferries run from the Weinam Creek terminal across to Russell, Macleay, Lamb and Karragarra islands. The suburb has no train station. The transport options are road, bus and ferry, and the nearest rail is well to the west of the Redlands. Once a market-gardening fringe, Redland Bay has spent the last decade turning into one of the council's main greenfield housing fronts, which is exactly why a buyer wants the numbers, not the brochure.
We pulled the recent house sales, the schools and catchments, the last 12 months of recorded offences, the council flood overlay and the census. Here is what they say. Reliable sales coverage for this suburb begins in 2024, so the price window starts there rather than reaching back into thinly recorded 2023.
Prices: a million-dollar house suburb from 2025
| Year | Houses sold | Median sold | P25 to P75 |
|---|---|---|---|
| 2024 | 356 | $911,200 | $810K to $1.10M |
| 2025 | 350 | $1,088,500 | $941K to $1.26M |
| 2026 to June | 79 | $1,200,000 | $1.06M to $1.33M |
The line is steep. The house median moved from $911,200 across 356 sales in 2024 to $1,088,500 across 350 sales in 2025. That is +19.5 percent in a single calendar year. The 79 houses sold so far in 2026 are medianing $1.2M, which is +31.7 percent on the 2024 figure, though that part-year number will move as more sales settle. Redland Bay crossed the million-dollar house median in 2025 and has stayed above it since.
This is a high-turnover suburb. More than 350 houses changed hands in each of 2024 and 2025, which is heavy volume for a single suburb and reflects the new estates still being built and sold across the southern Redlands. If you are weighing a block here for its split or future subdivision potential, we pulled the council records on what actually happens when you subdivide in Queensland.
Eyeing a Redland Bay house before prices run further? Check its storm tide and creek flood exposure for the exact address, free:
Schools: two government primaries inside, one high catchment out of suburb
Two schools sit physically inside Redland Bay, both government primaries:
- Redland Bay State School (government primary, Prep to 6, ICSEA 997, 820 students). Just under the national average of 1000.
- Scenic Shores State School (government primary, Prep to 6, ICSEA 1011, 234 students). A newer, smaller school just above the national average.
There is no high school inside the suburb. For state secondary schooling the suburb is overwhelmingly one catchment: about 93 percent of Redland Bay falls into Victoria Point State High School (ICSEA 960 at the senior-secondary level), with a small north-western sliver, roughly 7 percent, feeding Shailer Park State High School (ICSEA 998). Both sit near or just below the national average of 1000, so this is not a suburb buyers move to for a standout state high catchment. A family buying for the catchment should still confirm the official Queensland Department of Education boundary at the specific address, not the suburb name.
The primary catchment is split almost evenly. About 46 percent of the suburb feeds Redland Bay State School (ICSEA 997) and about 45 percent feeds Scenic Shores State School (ICSEA 1011), with small edges falling into Mount Cotton State School (ICSEA 1047) and Carbrook State School (ICSEA 1008). Anyone buying for a particular primary catchment should confirm the boundary at the exact address rather than the suburb centroid.
Crime: total broadly flat, with burglary down and car theft up
We mapped every recorded Queensland Police Service offence to its ABS meshblock and counted only the meshblocks that sit inside Redland Bay. Here is the 12-month picture to April 2026.
| Offence type | 12-month count |
|---|---|
| Other theft (excl. unlawful entry) | 209 |
| Traffic and related offences | 75 |
| Other property damage | 71 |
| Drug offences | 59 |
| Unlawful use of motor vehicle | 48 |
| Assault | 39 |
| Unlawful entry (burglary) | 35 |
| Good order offences | 28 |
| Fraud | 25 |
| Other offences against the person | 13 |
| Trespassing and vagrancy | 10 |
| Weapons Act offences | 9 |
| Handling stolen goods | 3 |
| Robbery | 2 |
| Arson | 2 |
| Miscellaneous offences | 2 |
The metric a residential buyer should actually watch is unlawful entry (residential burglary) and motor vehicle theft, rather than the total, which is lifted by general theft around the local centres. Here is the year-on-year comparison.
| 12-month window | Unlawful entries | Motor vehicle thefts | Total recorded offences |
|---|---|---|---|
| Apr 2024 to Apr 2025 | 57 | 30 | 604 |
| Apr 2025 to Apr 2026 | 35 | 48 | 630 |
The honest read is that the total barely moved (604 to 630). Underneath that, the two metrics split in opposite directions: residential burglary fell clearly (57 to 35) while motor vehicle theft rose (30 to 48). A buyer who parks on the street should weigh the car-theft trend; a buyer worried about break-ins is looking at a year that improved, not worsened.
Flood: the council overlay touches few homes, but coastal hazard is a separate question
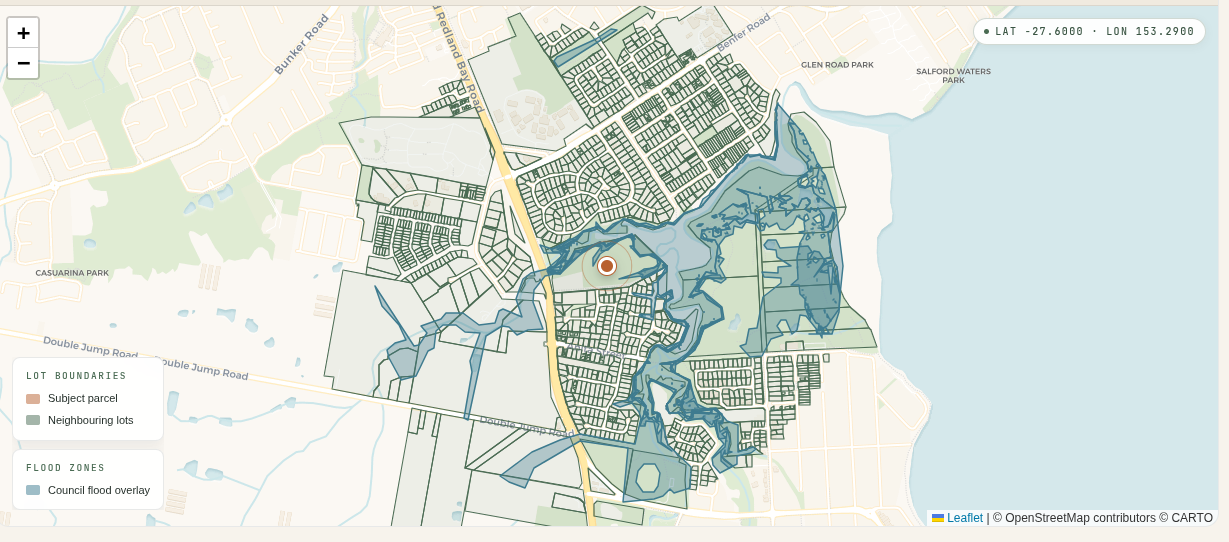
Of 929 mapped Redland Bay properties, 30 (3.2 percent) intersect the Redland City Council flood overlay: 27 carry a High rating and 3 a Medium rating. The overlay polygons follow the creek lines and low-lying drainage corridors through the suburb, and most of that mapped land is waterway and reserve rather than house blocks, which is why so few dwellings actually fall inside it.
One important caveat for a bayside suburb. The council flood overlay in our data covers creek and waterway flooding, not coastal storm-tide inundation. Storm tide is a distinct hazard for low-lying foreshore land on Moreton Bay and is not captured in the overlay figures above. Any buyer looking at a waterfront or near-shore block in Redland Bay should check the council's coastal hazard and storm-tide mapping for that specific address as a separate step, on top of the creek overlay we report here. The state's FloodCheck flood maps add historical flood extents for the same land as a further cross-check.
Who lives here: the census profile
The 2021 ABS census paints the Redland Bay SA2 as a settled, owner-occupier, family suburb:
- Population 17,765, median age 39, with an average household size of 2.8.
- Median weekly household income $2,074 and a median monthly mortgage of $2,076.
- Of 6,022 dwellings, 75.4 percent are owner-occupied (1,765 owned outright plus 2,775 with a mortgage) and 22.6 percent are rented.
- The dwelling mix is 5,692 houses against just 202 townhouses and 122 units. This is overwhelmingly a detached-house suburb with very little attached or apartment stock.
The high owner-occupier share and detached-house dominance are consistent with the price story: a steadily climbing house line and almost no unit market to speak of. The relatively low median age of 39 and the heavy 2024 and 2025 sales volume both reflect a suburb still adding new family households through greenfield estates.
Rental yield: low 3 percent on a house
QLD RTA bond data for postcode 4165 (which also covers Victoria Point and Mount Cotton, so read it as a postcode figure, not Redland Bay alone), most recent quarter to December 2025:
- 3-bedroom house: $650 per week median
- 4-bedroom house: $760 per week median
- 3-bedroom townhouse: $680 per week median
Against the 2025 Redland Bay house median of $1,088,500, a 3-bedroom house at $650 per week is a 3.1 percent gross yield, and a 4-bedroom at $760 is about 3.6 percent. A 3-bedroom townhouse at $680 against the thin townhouse market sits higher in gross terms, around 4.5 percent on a low-$800K townhouse, but the attached stock here is so small that the figure is a rough guide rather than a reliable read. The pattern is the usual one: houses are a capital-growth hold on a thin yield, not a yield play.
The honest answer
Is Redland Bay a good suburb? It depends on what a buyer is solving for.
- For an owner-occupier who wants a newer detached house near the water, with ferry access to the bay islands and a genuine bayside lifestyle: it fits, with the caveats that the house median is now $1.09M and climbing, there is no train station, and the commute to the Brisbane CBD is a road and bus run of around 35 km.
- For a family chasing schools: the two in-suburb primaries (ICSEA 997 and 1011) sit either side of the national average, and the dominant state high catchment, Victoria Point (ICSEA 960), is below it. This is a solid, average state-schooling suburb, not a catchment-premium one. Confirm the exact boundary at the address.
- For a yield-focused investor: a house here yields in the low 3s on a million-dollar-plus median. The growth has been strong, but the rent return is thin and there is little attached stock to chase a better return.
- For anyone looking at a waterfront or near-shore block: the creek flood overlay touches few homes, but coastal storm-tide hazard is a separate check. Get the property-specific coastal and flood mapping before bidding.
Redland Bay in 2026 is a fast-growing, owner-occupier-heavy, detached-house bayside suburb with average state schools, broadly flat headline crime and a creek flood overlay that touches only a small share of homes. The bayside setting adds a coastal-hazard question that the postcode cannot answer. The data argues for honest, address-level due diligence rather than a yes-or-no on the suburb name.
Methodology
- Sales: median sold prices computed from recent residential sale records, matched to G-NAF address PIDs inside the Redland Bay suburb boundary (postcode 4165). $200K to $5M filter to remove obviously erroneous rows. Houses only for the year table; townhouses and units omitted as too thin to median. Reliable coverage begins in 2024.
- Schools: ACARA MySchool ICSEA snapshot. Only schools physically inside the suburb are listed, with ICSEA taken from the school record.
- Catchments: Queensland Department of Education release. Catchment splits determined by spatial intersection of each catchment polygon with the Redland Bay suburb boundary. High school ICSEA quoted at the senior-secondary level.
- Crime: Queensland Police Service recorded offence records, meshblock-coded, for the latest 12 months and the prior 12 months. Only meshblocks spatially inside Redland Bay are included. Records begin mid-March 2024.
- Flood: Redland City Council flood overlay, spatially intersected with G-NAF property points inside the suburb. This overlay covers creek and waterway flooding; coastal storm-tide inundation is a separate hazard not included in these figures.
- Census: ABS 2021 Census, Redland Bay SA2. Population, age, income, tenure and dwelling structure.
- Rentals: QLD Residential Tenancies Authority bond statistics, postcode 4165, most recent quarter (December 2025).
Looking across the bay? Our Redcliffe and Scarborough deep dives apply the same lens to two other waterfront suburbs, and the flood risk tool checks any Redland Bay address against the overlay layers. For the wider Brisbane picture, see which streets carry the worst flood risk and the suburbs where recorded crime is falling, or browse all our Queensland suburb research.
Want the same check on a specific address in Redland Bay, or any other address in Queensland? Try it below.