
Redcliffe is the kind of suburb people have an opinion about before they look at a single number. A bayside peninsula about 28 km north of the Brisbane CBD, wrapped by Moreton Bay on three sides, historically a holiday and retirement town, now squarely inside the commuter belt. It sits in the Moreton Bay council area, not Brisbane City, which matters for rates, planning and flood mapping. The question for a buyer is whether the reputation matches the data.
We pulled three years of house and unit sales, the schools and catchments, the last 12 months of recorded offences, the flood overlays and the census. Here is what they say. We stopped the price window at 2023 on purpose, because anything older drags in COVID-era distortion and turns a clean story into a noisy one.
Prices: houses up 20 percent in two years, then a thin 2026
| Year | Houses sold | Median sold | P25 to P75 |
|---|---|---|---|
| 2023 | 146 | $750,000 | $665K to $870K |
| 2024 | 171 | $820,000 | $731K to $955K |
| 2025 | 153 | $900,000 | $800K to $1.15M |
| 2026 to June | 29 | $1,250,000 | $999K to $1.50M |
The 2023-to-2025 line is the part to trust. $750,000 to $900,000 across two full calendar years is +20 percent on the median, or about 9.5 percent a year. That is a firm, steady climb rather than a spike.
Units and apartments tell a related story, with the same caveat about thin samples. 11 units sold in 2023 at a median of $500K. 42 sold in 2025 at $750K. The 2026 partial unit median sits at $1.04M off 32 sales, but that is almost entirely beachfront apartment stock on Marine Parade and Prince Edward Parade, much of it three-bedroom, much of it above $1.2M. The typical Redcliffe unit is not a million-dollar unit. The million-dollar units are the ones with the bay out the front window.
Schools: a mixed catchment map, address matters
Three schools sit physically inside the Redcliffe suburb boundary:
- Redcliffe State High School (government, co-educational, ICSEA 1004, 1,444 students). Sits almost exactly on the national average of 1000.
- Redcliffe Special School (government, ICSEA 957, 89 students). A specialist setting, not a mainstream comparison point.
- Edu Space Redcliffe (independent secondary, ICSEA 883, 30 students). Very small, specialist independent provider, not a general-intake option.
The catchment map is where Redcliffe gets genuinely split, so the address matters more than the suburb name. For state secondary, most of Redcliffe falls into Redcliffe State High School (ICSEA 1004), but part of the suburb sits in the Clontarf Beach State High School catchment (ICSEA 948, in neighbouring Clontarf). For state primary, Redcliffe is carved across at least three catchments depending on the street: Scarborough State School (ICSEA 1015), Humpybong State School in Margate (ICSEA 974) and Kippa-Ring State School (ICSEA 899). That is a wide spread, from the 54th percentile down toward the 10th, inside one suburb.
The practical takeaway: anyone buying in Redcliffe for a specific state school should check the official Queensland Department of Education catchment at the exact address, not the suburb centroid. The centroid lands in Scarborough State School and Redcliffe State High, but streets only a few blocks apart fall into very different catchments.
Crime: roughly flat, and not the profile people assume
We mapped every recorded Queensland Police Service offence to its ABS meshblock and counted only the meshblocks that sit inside Redcliffe. Here is the most recent 12-month picture, to April 2026 (the date the recorded-offence data currently runs to).
| Offence type | 12-month count |
|---|---|
| Other theft (excl. unlawful entry) | 523 |
| Good order offences | 157 |
| Drug offences | 136 |
| Other property damage | 105 |
| Assault | 95 |
| Unlawful entry (burglary) | 75 |
| Traffic and related offences | 63 |
| Fraud | 35 |
| Unlawful use of motor vehicle | 31 |
| Weapons Act offences | 25 |
| Trespassing and vagrancy | 23 |
| Other offences against the person | 16 |
| Handling stolen goods | 16 |
Two things stand out. First, "other theft" dominates the table at 523 incidents, far ahead of anything else. For a busy bayside strip with a foreshore, a jetty, cafes and a constant flow of day visitors, a lot of that is opportunistic theft in public and from parked cars, not home break-ins. It inflates any headline "total offences" number in a way that overstates the residential picture.
Second, the metric a resident actually cares about, unlawful entry (residential burglary), is moderate and not trending up. Here is the year-on-year comparison on the two metrics that matter most to a home buyer.
| Metric | Prior 12m | Latest 12m |
|---|---|---|
| Total recorded offences | 1,295 | 1,318 |
| Unlawful entry (burglary) | 81 | 75 |
| Unlawful use of motor vehicle | 13 | 31 |
Total recorded crime is essentially flat year on year, up about 1.8 percent. Residential burglary actually fell slightly, from 81 to 75. The one line going the wrong way is motor vehicle theft, which more than doubled from 13 to 31, though off a small base. For a suburb of this size and visitor volume, the residential-safety read is steady rather than deteriorating.
Flood: about a fifth of addresses touch a flood overlay
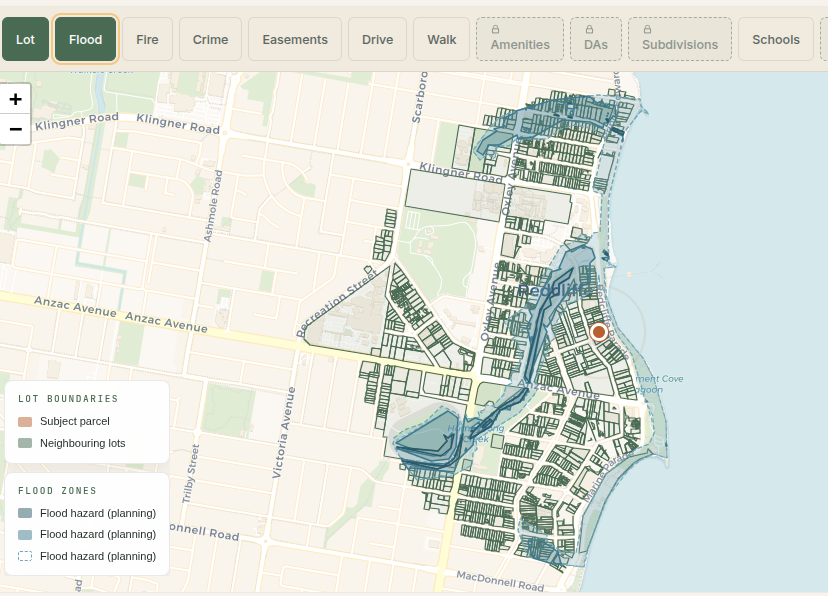
Redcliffe is a low-lying peninsula surrounded by Moreton Bay, so flood and coastal-inundation mapping is worth taking seriously. We intersected every Redcliffe address point against the Moreton Bay flood overlay. 1,690 of 8,681 addresses (19.5 percent) fall inside at least one mapped flood overlay.
A clear word on what that number is and is not. The Moreton Bay overlay in our data flags whether an address sits in a mapped flood-affected area, but it does not grade severity the way the Brisbane City creek-and-river layers do, so we are not going to put a high, medium or low label on individual streets here. The honest read is that roughly one in five Redcliffe addresses is flagged, four in five are clean, and on a bayside peninsula the flagged addresses cluster toward the low-lying and waterfront edges rather than scattering randomly. This is a suburb where the specific address matters far more than the postcode. The state's FloodCheck flood maps add historical flood extents for the same land as a further check.
Looking at a Redcliffe place near the foreshore? One in five addresses here is flagged. Check whether yours is one of them, free:
Who lives here: an older, settled profile
The 2021 census profile for the Redcliffe SA2 helps explain the suburb's character. The median age was 52, well above the Greater Brisbane figure, which fits the long-standing retiree and downsizer pull of a bayside town. Median household income was $1,111 per week, the average household size was 2.0 people, and the median monthly mortgage repayment was $1,600. This is a settled, older, smaller-household suburb rather than a young-family growth frontier, though the price and unit data suggest that mix is slowly shifting as new apartment stock arrives on the waterfront.
Transport: on the peninsula line, but no station in the suburb
Redcliffe is served by the Redcliffe Peninsula railway line, which opened in October 2016 and finally connected the peninsula to the Brisbane network. The important nuance for a buyer: there is no train station inside the Redcliffe suburb itself. The line runs through Mango Hill, Murrumba Downs and Rothwell and terminates at Kippa-Ring, which is the closest station to the Redcliffe town centre. In practice that means a short drive or bus to the station rather than a walk to the platform for most of the suburb, so proximity to Kippa-Ring station is itself an address-level variable worth checking.
Rental yield: low-to-mid 3 percent on a house
QLD RTA bond data for postcode 4020, most recent quarter (December 2025):
- 3-bedroom house: $620 per week median
- 4-bedroom house: $775 per week median
- 2-bedroom flat or unit: $500 per week median
- 3-bedroom townhouse: $650 per week median
Against the 2025 house median of $900,000, a 3-bedroom house at $620 per week is about a 3.6 percent gross yield. A 2-bedroom flat at $500 per week against the 2025 unit median of $750,000 is about 3.5 percent gross. These are ordinary middle-ring south-east Queensland yields. Note the rental data is reported at the postcode level, so it blends Redcliffe with Scarborough and Newport, while the sale prices above are the Redcliffe suburb only.
One thing the headline yield does not capture is demand stability. Redcliffe Hospital, a major Metro North public hospital, is one of the peninsula's larger employers, and a hospital of that size underpins steady, year-round rental demand from healthcare staff. For an investor that matters less for the yield number itself and more for the lower vacancy risk a big, stable local employer tends to bring.
The honest answer
Is Redcliffe a good suburb? It depends on what a buyer is solving for.
- For an owner-occupier who wants the bay, a foreshore lifestyle and a settled, older community about 28 km from the CBD: the appeal is real, and houses have grown a steady 20 percent over two years to a $900K median. Just budget for a drive or bus to the Kippa-Ring train station rather than a walk.
- For a family chasing one specific state school catchment: do the address-level check first. Redcliffe is split across primary catchments ranging from ICSEA 899 (Kippa-Ring) to 1015 (Scarborough), and across two secondary catchments (Redcliffe SHS at 1004 and Clontarf Beach SHS at 948). The suburb name alone does not tell you which one you are in.
- For a yield-focused investor: houses run about 3.6 percent gross, units around 3.5 percent. That is in line with the rest of middle-ring south-east Queensland, so no clear edge either way.
- For anyone near the foreshore or the low-lying flats: roughly one in five Redcliffe addresses sits in a mapped flood overlay, and the exposure concentrates toward the water. Get the property-specific flood and storm tide check before bidding.
Redcliffe in 2026 is a repricing bayside suburb with a steady house market, a settled older population, a genuinely split school map and real but concentrated flood exposure on the low-lying edges. The data argues for honest, address-level due diligence rather than a yes-or-no on the suburb name.
Methodology
- Sales: median sold prices computed from recent residential sale records, matched to G-NAF address points inside the Redcliffe suburb boundary (postcode 4020, excluding Scarborough and Newport which share the postcode). $200K to $5M filter to remove obviously erroneous rows. Houses and units medianed separately; the 2026 figures are partial-year and low-count and flagged as such.
- Schools: ACARA ICSEA snapshot. Schools listed are those physically inside the suburb boundary; catchment ICSEA values were cross-checked against the same school records.
- Catchments: Queensland Department of Education catchment polygons, intersected with the Redcliffe suburb boundary. The centroid catchment and all intersecting catchments were both checked.
- Crime: Queensland Police Service recorded offence records, meshblock-coded, for the 12 months to April 2026 and the prior 12 months for the trend. Only meshblocks majority-inside the Redcliffe suburb boundary are included.
- Flood: Moreton Bay flood overlay, spatially intersected with G-NAF address points inside the suburb. The overlay flags presence in a mapped flood area but is not severity-graded in our data.
- Census: ABS 2021 Census, Redcliffe SA2 (code 313051379).
- Rentals: QLD Residential Tenancies Authority bond statistics, postcode 4020, most recent quarter (December 2025). Reported at the postcode level.
Mapping the peninsula and beyond? Our Scarborough and Narangba deep dives run the same price, crime and flood analysis, and the flood risk tool checks any Redcliffe address against the council overlays. For the wider Brisbane picture, see which streets carry the worst flood risk and the suburbs where recorded crime is falling, or browse all our Queensland suburb research.
Want the same check on a specific address in Redcliffe, or any other address in Queensland? Try it below.