
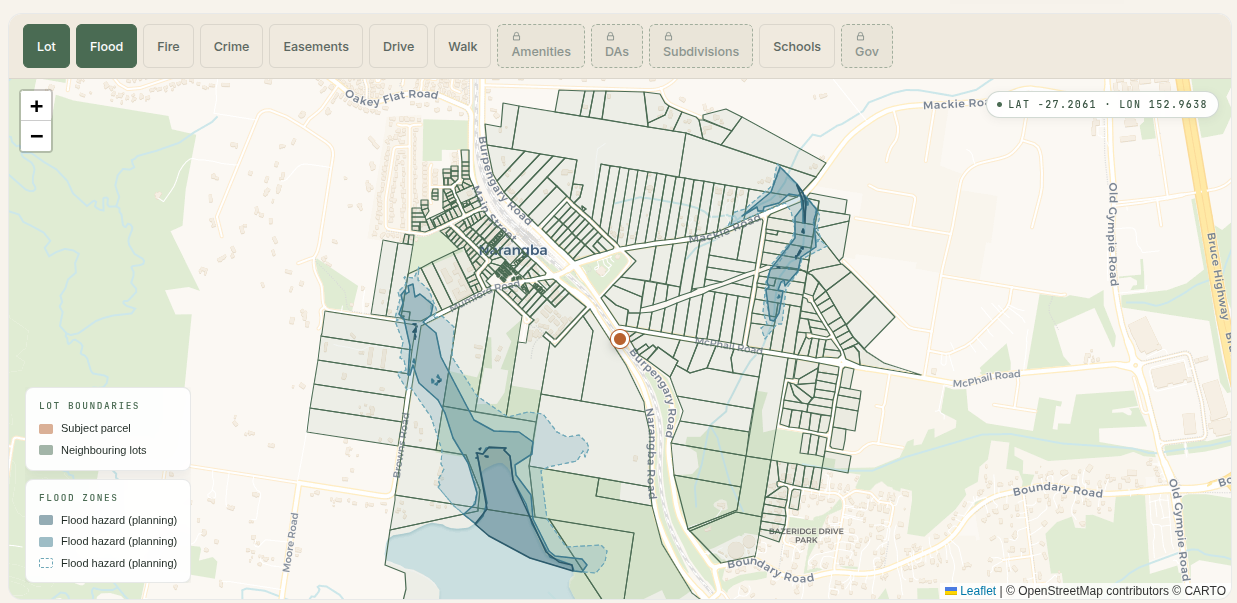
Narangba is a settled, family-oriented suburb roughly 33 km north of the Brisbane CBD, inside the Moreton Bay Regional Council area rather than Brisbane City. That council line matters: it sets the rates, the planning scheme and the flood overlay that apply to a block here, and they are not the Brisbane City ones. The suburb is overwhelmingly detached houses on standard blocks, wrapped by the Moreton Bay commuter belt. It is neither a glamour suburb nor a problem suburb, which is exactly why a buyer wants the numbers, not the vibe.
We pulled the sales records, the schools and catchments, the last 12 months of recorded offences, the council flood overlay and the census. Here is what they say. One honest caveat up front: our sale records only become dense from the start of 2024, so the 2023 row below is a thin partial sample and the growth story is told on the 2024-onward line where the data is solid.
Prices: through $900K in 2025, and past a million in 2026
| Year | Houses sold | Median sold | P25 to P75 |
|---|---|---|---|
| 2023 (thin sample) | 19 | $699,000 | $625K to $765K |
| 2024 | 405 | $831,000 | $742K to $950K |
| 2025 | 424 | $925,500 | $835K to $1.07M |
| 2026 to June | 134 | $1,100,000 | $982K to $1.24M |
The 2024-to-2025 line is the one to trust. $831,000 to $925,500 across one full calendar year, a +11.4 percent move on the median, on healthy volume (405 then 424 house sales). Through the first part of 2026, 134 houses have medianed $1,100,000, though that is a part-year figure and will settle as more sales come through. Either way, Narangba has crossed from a high-$800K house suburb into a seven-figure one inside about eighteen months.
There is very little else to buy here. The attached and unit market is tiny: only single-digit-to-low-double-digit townhouse sales a year and barely any units, which is too thin to quote a reliable median against. If you are weighing a block for its split or development potential, we pulled the council records on what actually happens when you subdivide in Queensland.
Found a Narangba house still under budget? Before you bid, check whether it sits in the creek overlay and what the block can really do, free:
Schools: four government schools in the suburb, all near the national average
Four government schools sit physically inside Narangba. ICSEA is the ABS-derived index of socio-educational advantage, where 1000 is the national average:
- Narangba Valley State School (government primary, Prep to 6, ICSEA 1016, 1,067 students). Just above the national average and the largest primary in the suburb.
- Narangba State School (government primary, Prep to 6, ICSEA 997, 641 students). Right on the national average.
- Jinibara State School (government primary, Prep to 6, ICSEA 980, 611 students). A touch below average.
- Narangba Valley State High School (government, years 7 to 12, ICSEA 999, 1,821 students). Essentially on the national average.
For state high school, most of Narangba feeds Narangba Valley State High School (ICSEA 999), which covers roughly two thirds of the suburb by area. The edges fall into neighbouring catchments: a western-and-southern slice into Burpengary State Secondary College (ICSEA 964) and smaller pockets into Dakabin State High School (ICSEA 940). All three sit at or below the national average, with the in-suburb high school the strongest of them. A family buying for the catchment should confirm the official Queensland Department of Education boundary at the specific address, not the suburb name.
The state primary catchment is split too. About 39 percent of the suburb feeds Narangba Valley State School (ICSEA 1016) and about 26 percent feeds Narangba State School (ICSEA 997), with smaller shares running into Burpengary Meadows State School (ICSEA 994), Jinibara State School (ICSEA 980) and Moreton Downs State School (ICSEA 945). The spread is narrow, all within a band close to the national average, but the exact catchment still turns on the street, so check the boundary at the address.
Crime: total recorded offences up, residential burglary and car theft down
We mapped every recorded Queensland Police Service offence to its ABS meshblock and counted only the meshblocks that sit inside Narangba. Here is the 12-month picture to 10 April 2026.
| Offence type | 12-month count |
|---|---|
| Other theft (excl. unlawful entry) | 253 |
| Traffic and related offences | 136 |
| Other property damage | 84 |
| Drug offences | 71 |
| Good order offences | 70 |
| Unlawful entry (burglary) | 62 |
| Assault | 60 |
| Unlawful use of motor vehicle | 25 |
| Fraud | 17 |
| Other offences against the person | 15 |
| Weapons Act offences | 14 |
| Trespassing and vagrancy | 10 |
| Robbery | 9 |
| Handling stolen goods | 9 |
| Miscellaneous offences | 6 |
| Arson | 5 |
| Other homicide | 2 |
| Liquor (excl. drunkenness) | 1 |
As in most suburbs, "other theft" tops the list and is a mixed bag of shop theft, theft from vehicles and similar, not a clean residential signal. The metric a residential buyer should actually watch is unlawful entry (residential burglary) and motor vehicle theft. Here is the year-on-year comparison.
| 12-month window | Unlawful entries | Motor vehicle thefts | Total recorded offences |
|---|---|---|---|
| Apr 2024 to Apr 2025 | 73 | 28 | 786 |
| Apr 2025 to Apr 2026 | 62 | 25 | 849 |
The honest read is mixed but reassuring on the metrics that matter to a resident. Total recorded offences rose (786 to 849), in line with a broad regional uptick. But the two categories a homeowner cares about most both fell: residential burglary came down (73 to 62) and motor vehicle theft eased (28 to 25). So the headline total is up while the at-home risk indicators are down, which is a more comfortable combination than the reverse.
Flood: about 13 percent of properties touch the council overlay
Narangba sits in the Moreton Bay Regional Council area, so its flood mapping is the council planning scheme overlay, not the Brisbane City one. Of 1,107 properties we hold inside the suburb boundary, 144 (13.0 percent) intersect the council flood overlay. The other 87 percent of mapped properties sit clear of it.
Thirteen percent is a real but contained figure, and it clusters along the suburb's low-lying creek and drainage lines rather than scattering at random. This is the kind of suburb where the specific address matters far more than the postcode for flood: two houses a few streets apart can have completely different overlay exposure, which is also why suburb-level flood claims mislead in both directions.
Who lives here: the census profile
The 2021 ABS census paints Narangba as a family suburb of owner-occupiers with children, on the younger side for the region:
- Population 20,914, median age 33 (younger than the Brisbane median, consistent with a family-and-children suburb).
- Median weekly household income $2,207 and a median monthly mortgage of $1,900, on an average household size of 3.1 people.
- Of 6,450 occupied private dwellings, 75.0 percent are owner-occupied (1,264 owned outright plus 3,571 with a mortgage) and 23.7 percent are rented.
- Couple-with-children is the single largest household type (3,093 of 6,450), ahead of couples with no children (1,589) and lone-person households (719).
- The dwelling mix is 6,187 houses against 238 townhouses and just 14 units. This is a house suburb with almost no attached or apartment stock.
The high owner-occupier share, the family-heavy household mix and the near-total dominance of detached houses all point the same way: stock that turns over as family homes rather than investor product, which is consistent with the steady, volume-backed climb in the price table above. The population, age, income and tenure figures here come from ABS Census QuickStats for the Narangba SA2.
Getting to work: a car suburb with a minority rail commute
The census journey-to-work data for the Narangba SA2 is heavily car-led. Of recorded commute trips, 6,494 were as a car driver and 452 as a car passenger, against 297 by train, 22 by bus and 1,609 who worked from home. So while there is a real train-commuting cohort here, the everyday reality for most households is the car. A buyer who needs a daily rail commute should check the actual travel time and parking at their nearest station rather than assume it, and weigh that against the car-led pattern the data shows.
Rental yield: mid-3 percent on a house
QLD Residential Tenancies Authority bond data for postcode 4504, which in our data is effectively Narangba on its own, most recent house quarter to December 2025:
- 3-bedroom house: $600 per week median
- 4-bedroom house: $660 per week median
- 3-bedroom townhouse: $540 per week median (September 2024, the latest townhouse figure available)
Against the 2025 Narangba house median of $925,500, a 3-bedroom house at $600 per week is a 3.37 percent gross yield and a 4-bedroom at $660 is 3.71 percent. The 3-bedroom townhouse at $540 against a thinly-traded townhouse market works out higher on paper, but with so few townhouse sales the underlying value is hard to pin down. The pattern is the usual outer-ring one: houses here are a capital-growth hold on a mid-3s yield, not a high-income play.
The honest answer
Is Narangba a good suburb? It depends on what a buyer is solving for.
- For an owner-occupier family who wants a detached house, standard blocks, schools near the national average and an outer-northern position: it fits the brief, with the caveat that the house median has just crossed seven figures and the commute is car-led for most households.
- For a family chasing the best school catchment: the in-suburb Narangba Valley State High School (ICSEA 999) is the strongest of the local high catchments, and the primary catchments all sit in a narrow band near average. Check which side of the line your specific address falls on.
- For a yield-focused investor: a house here yields in the mid 3s, in line with the outer-northern market, on a tiny attached-stock alternative. No standout yield edge either way.
- For anyone near the creek and drainage lines: get the property-specific flood overlay before bidding. About 13 percent of mapped properties touch the council overlay, and the address matters far more than the suburb name.
Narangba in 2026 is a family-heavy, owner-occupier, detached-house suburb in the Moreton Bay area where the typical house has pushed past a million on solid volume. Schools cluster near the national average, residential burglary and car theft are easing even as total recorded offences rise, and flood exposure is contained but real along the low-lying lines. The data argues for honest, address-level due diligence rather than a yes-or-no on the suburb name.
Methodology
- Sales: median sold prices computed from recent residential sale records, matched to address points inside the Narangba suburb boundary (postcode 4504). $200K to $5M filter to remove obviously erroneous rows. Houses only; townhouses and units omitted as too thin to median. The 2023 row is flagged as a thin partial sample (19 sales).
- Schools: ACARA MySchool ICSEA snapshot. Only schools physically inside the suburb are listed, with ICSEA taken from the school record.
- Catchments: Queensland Department of Education release. Catchment splits determined by spatial intersection of each catchment polygon with the Narangba suburb boundary; ICSEA quoted from the matching school record.
- Crime: Queensland Police Service recorded offence records, meshblock-coded, for the latest 12 months and the prior 12 months. Only meshblocks spatially inside Narangba are included. Records begin mid-March 2024.
- Flood: Moreton Bay Regional Council planning scheme flood overlay, spatially intersected with property points inside the suburb.
- Census and commute: ABS 2021 Census, Narangba SA2. Population, age, income, tenure, household composition, dwelling structure and journey to work.
- Rentals: QLD Residential Tenancies Authority bond statistics, postcode 4504, most recent quarter available per dwelling type.
Comparing the rest of Moreton Bay? See how Redcliffe and Scarborough stack up on the same measures, then run a specific Narangba address through our flood risk tool before you commit. For the wider Brisbane picture, see which streets carry the worst flood risk and the suburbs where recorded crime is falling, or browse all our Queensland suburb research.
Want the same check on a specific address in Narangba, or any other address in Queensland? Try it below.