
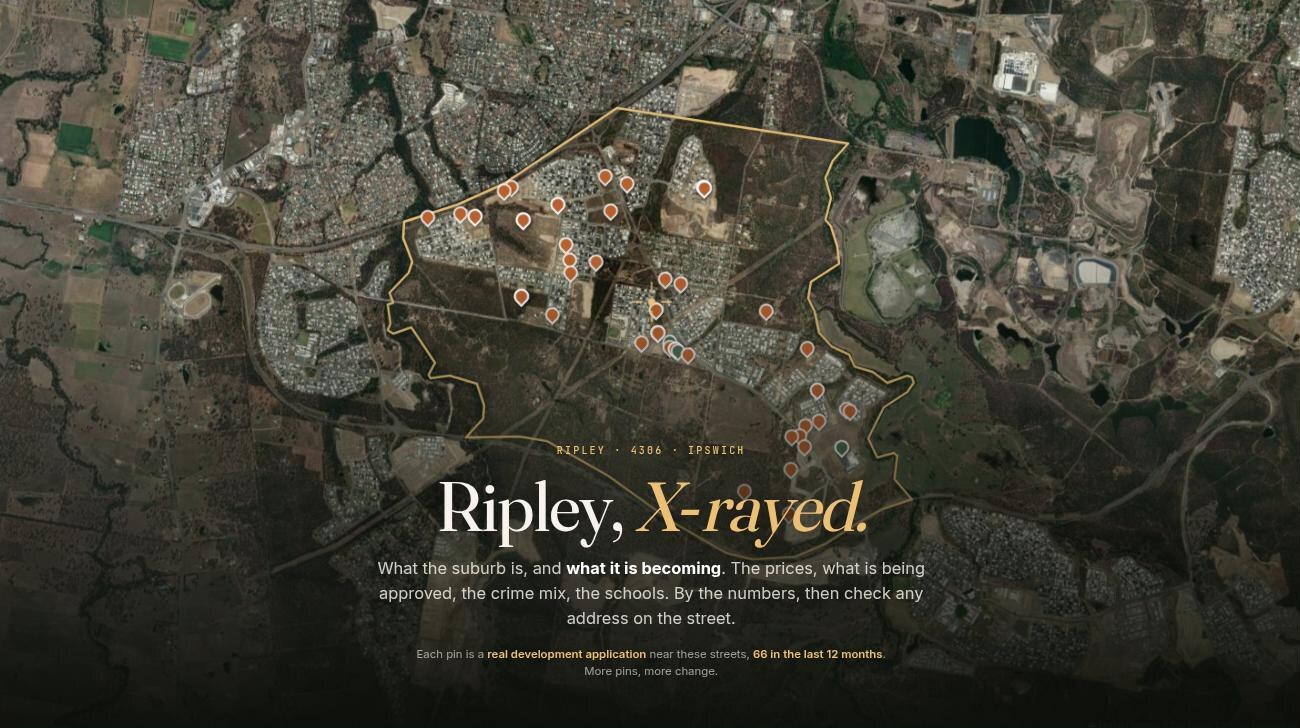
Ripley's house median jumped 52% in four years. Everyone shows you that number. The full crime mix and the 269 encumbrance parcels? Nobody shows you those.
- Postcode: 4306, and it covers both Ripley and South Ripley
- Council: Ipswich City Council
- Planning: inside the Ripley Valley Priority Development Area, declared 8 October 2010
A while back I watched someone ask about Ripley on a property forum. Where should I buy around Ipswich, is Ripley any good, the usual. The replies were all vibes. Great for young families. Heard its rough near the shops. Twenty answers, not one number.
I run a free data hub for QLD properties, so I pulled what we hold on the suburb. The growth story everyone repeats checks out. But we also hold two datasets on Ripley that suburb writeups never touch: the recorded offences, and whats registered on the titles. Youre getting all of it.
The price ladder, because thats why youre here
| Window | Median house price |
|---|---|
| 2022 | $612,000 |
| Last 12 months | $900,000 |
| 2026 first half | $927,500 |
From $612,000 in 2022 to $927,500 in the first half of 2026. Thats 52% in four years. The last 12 months did much of the work: 311 house sales at a $900,000 median against $762,000 the year before, up 18.1% in a single year. And they sell in a median of 22 days.
Fast market.
The crime numbers, and how to read them honestly
Heres the part nobody publishes. QPS recorded 429 offences across the Ripley area in the last 12 months. Not a big scary number, and not zero either.
| Offence category | Recorded offences |
|---|---|
| Other theft | 133 |
| Traffic and related offences | 57 |
| Unlawful entry | 48 |
| Property damage | 41 |
| Unlawful use of motor vehicle | 34 |
One honest caveat before anyone panics or relaxes. These are offences mapped to the area, and in a greenfield suburb theft skews toward construction sites and just-occupied houses. An offence near the shops and an offence in your cul-de-sac land in the same bucket. Per-street reality varies a lot.
And heres the trap with comparisons. Every suburb page on our data hub shows the same area-mapped offence mix, so compare like with like there. When someone says Ripley is rougher than the estate up the road, ask what theyre comparing it against. Usually a vibe, not a number.
269 parcels carry a registered encumbrance. Yarrabilba has 3
An encumbrance is a dealing registered on the title that limits what you can do with the land. In a master-planned estate that usually means the developer's covenant: what you can build, which materials face the street, fencing, sometimes how quickly you must build after settlement.
Ripley has 269 registered encumbrance parcels in our titles data. Thats the highest of the estate suburbs we track, and its not close. Yarrabilba shows 3.
This is not me saying covenants are bad. Estates use them to stop your neighbour parking a rusting truck body on the front lawn, its partly why the streets look tidy. But a covenant binds you after settlement whether you read it or not, and heres the bit most buyers miss: the title search only lists the dealing number. You have to order the dealing document to know whats in it. Most people never do.
Order it. Read it before you sign, not after.
The smallest blocks of the big estates
| Suburb | Median lot size | Share under 400sqm |
|---|---|---|
| Ripley | 391sqm | 51.5% |
| Yarrabilba | 400sqm | 43.8% |
| Flagstone | 614sqm | 23.1% |
More than half of Ripley's house sales sit on blocks under 400 square metres. Smallest of the three big estate corridors, Flagstone runs a 614sqm median by comparison.
Small lots arent a defect, theyre the product, its how a house lands under a price young families can reach. But put this table next to the covenant section and you see the shape of it: a compact block AND a dealing on title telling you what you can do with it. If youre picturing a shed or a granny flat down the track, the block and the covenant decide that together, not the masterplan brochure.
Check the lot size, easements and flood mapping of any Ripley address, free and no signup:
Rent, yield, and a couple of cracks
Median advertised rent in Ripley is $650 a week, which against the $900,000 sale median works out to roughly 3.8% gross. Advertised house rentals, last 12 months.
3.8% is not a number investors ring each other about. This is an owner-occupier suburb with tenants in it.
And even in a 22-day market the edges show. 27 listings were withdrawn without selling in the last 12 months, and sellers cut the asking price 18 times. A hot market forgives a lot. It doesnt forgive overpricing.
South Ripley, the dearer sibling
Same postcode, 4306 covers both. South Ripley put through 225 house sales in the last 12 months at a $950,000 median, up 20% on the prior 12 months (same house-sales cohort as every number in this post). The newer sibling now trades above Ripley itself.
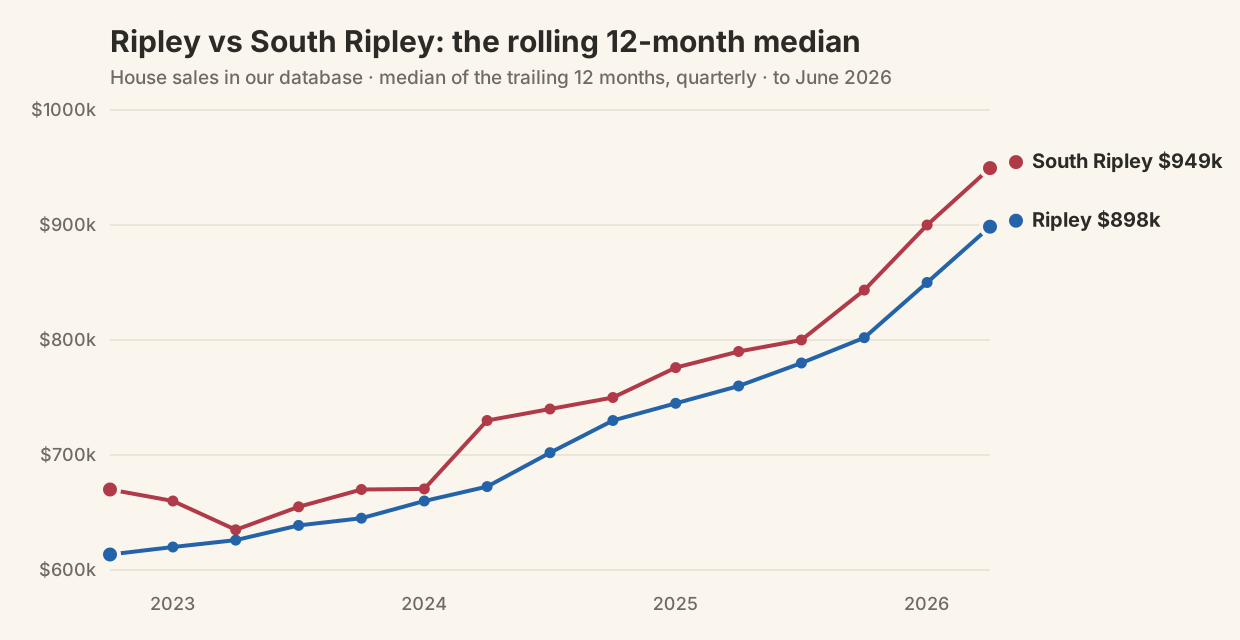
For South Ripley's own offence mix, check its suburb page on the data hub, its mapped the same way.
Why the council DA register looks quiet (it isnt)
Heres one that catches even careful buyers. Ripley sits inside the Ripley Valley Priority Development Area, declared 8 October 2010. The council register around these streets is genuinely busy, subdivisions and site works mostly. But thats not the whole pipeline. Inside a PDA the master-plan approvals, the big land releases and neighbourhood-scale stuff, are assessed by Economic Development Queensland, not council.
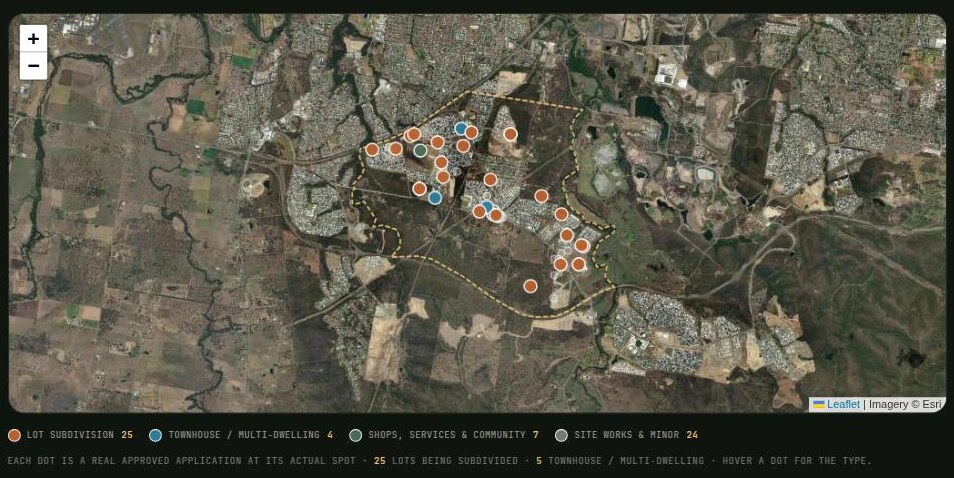
So the council feed shows you the retail layer of change and quietly misses the wholesale layer. If youre trying to gauge incoming supply, and in an estate corridor you should, check EDQ's records for the Ripley Valley PDA as well as council's.
The verdict on Ripley
Depends what youre buying it for, and thats an answer, not a dodge.
The growth is real. Up 18.1% in a single year, 52% across four, and the 22-day selling time says buyers arent hesitating.
The trade-offs are just as real. Smallest blocks of the big estates, and more registered encumbrances than any estate suburb we track. Yield near 3.8% means the investment case leans almost entirely on growth continuing. Then theres the crime ledger, which reads scarier than the per-street reality. Still deserves your eyes.
Everything here came out of the free data hub for QLD properties I run, propertyxray.com.au. Look up Ripley yourself, or better, the suburb youre weighing it against. Then go read a title or two before you fall in love with a display home.
Quick questions people actually search
What is Ripley's postcode?
4306, and it covers both Ripley and South Ripley, so check which suburb the listing actually sits in.
What council is Ripley under?
Ipswich City Council. Development inside the Ripley Valley PDA (declared 8 October 2010) is mostly assessed by Economic Development Queensland, not council.
Is Ripley safe?
QPS recorded 429 offences across the Ripley area in 12 months, led by other theft at 133. Per-street experience varies a lot, and greenfield theft skews toward construction sites. Dont accept safe or rough from anyone without a number.
How big are the blocks in Ripley?
Median 391sqm among house sales in our database, 51.5% under 400sqm. The smallest of the big SEQ estate suburbs we track.
Methodology
- Sales medians are house sales from registered sales in our database, each table labelled with its window. The 12-month comparison is the latest 12 months against the prior 12. South Ripley is the same cohort under its own label.
- Rent is the median advertised weekly rent for houses over 12 months. Yield is that rent annualised against the 12-month sale median, gross.
- Crime is QPS recorded offences under the "Ripley" suburb label, 12 months. We publish counts with the boundary caveat instead of a safety score.
- Encumbrance figures count parcels carrying a registered encumbrance in Queensland titles data. The count says one exists, not whats in it.